
| MARKET CONDITIONS Given more than his normal 30-second soundbite on mainstream media, Marc Faber is able to discuss in considerably more detail his views on the massive growth in global financialization (when compared to real economies) noting that "one day, this financial bubble will have to adjust on the downside." This will occur via either an inflationary burst or a collapse of the system. Simply put, "it's gonna end one day," either through war or financial collapse, "it will be very painful." The Gloom, Boom, and Doom Report editor notes current asset valuations are driven by excess credit creation, printing money, and distorted market signals, and the unintended consequences of the effect on investor psychology are perfectly mis-timed. Faber concludes with a discussion of the inflationary impact of US monetary policy and where it is seen (and not seen) and the global social unrest implications of middle class discontent. |
|
0 Comments
Another week goes by and the American consumer still lives. Makes you wonder if the U.S. economy is doing better than the pessimists would have you believe. We've pointed out the soaring profits and share prices of hotel and home improvement chains as evidence. Today, we provide an update on another key idea... retail. A useful way to track retail stocks is with the S&P Retail Fund (XRT). This fund is comprised of consumer stocks, like Netflix, J.C. Penney, Best Buy, Whole Foods, Tiffany, Macy's, Saks, and Men's Wearhouse. It rises and falls with America's shopping habits. As you can see from the chart below, America is still shopping. Last summer, this fund traded for $57 per share. Over the past 12 months, shares have climbed past $80 to reach a multiyear high. Sure, the American economy has problems, but as long as XRT is soaring, we have to say things aren't all that bad. 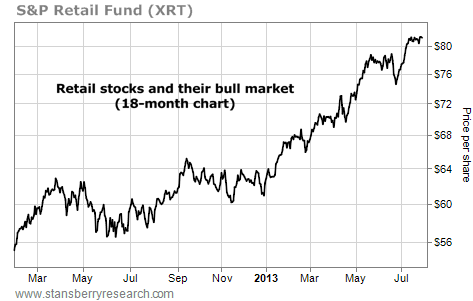
Despite Declining Deficit, Foreigners Aren’t Bailing Us Out, So the Fed Will Keep QE Going7/29/2013
The basic imbalance driving our economy is the government deficit, which spun out of control as a result of the Credit Crisis of 2008/9. But the sequester, improving tax base, lower interest rate, and elimination of stimulus spending have caused the big government deficit, while still extreme, to drop to half its previously nosebleed levels. 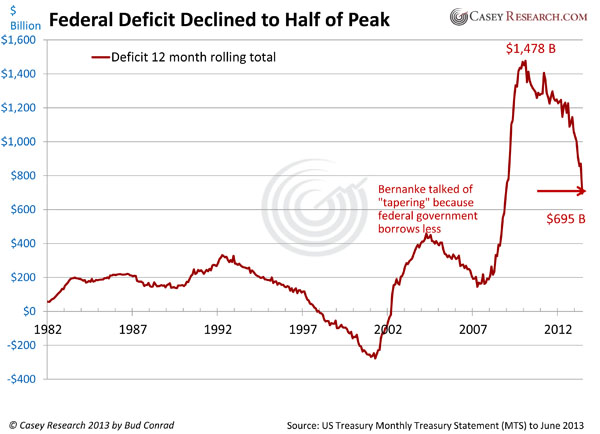 Even so, the deficits remain well out of proportion for a sustainable future. Projections for future government expenditures, including those related to the masses of retiring baby boomers, are on track to increase exponentially. Especially given that the deficits are actually much worse than generally discussed. Honest accounting would include the growing liabilities for retirees in the current accruals, resulting in deficits running closer to $5 trillion per year. Foreigners recycling their trade surpluses have been an important source of purchases for US government debt. As you can see from the chart of long-term securities purchases by foreigners, that buying collapsed during the crisis. And, interestingly, it has recently fallen sharply again. 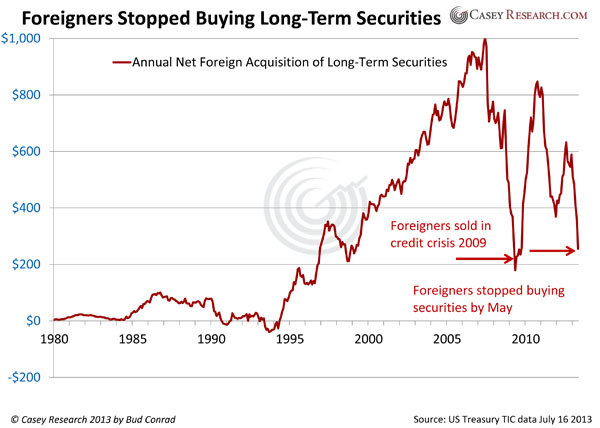 Offsetting the reduction in purchases of US debt by foreigners, the Fed has stepped in with multiple quantitative easings (QE), buying government securities itself in order to add liquidity and drive interest rates down. The shift into an accommodative policy is easy to see in the big picture of the holdings of Treasuries at the Fed: 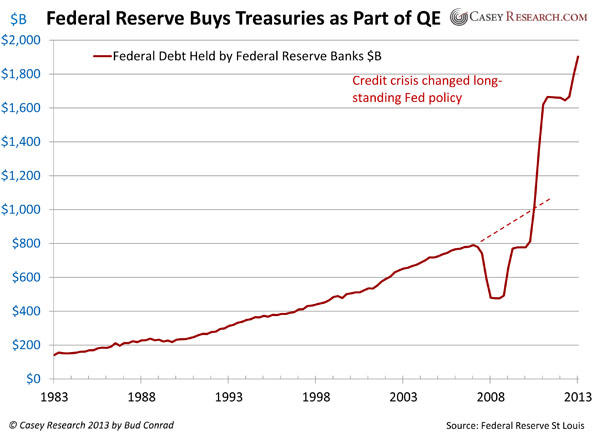 Simply, the loss of foreign enthusiasm for US government debt would normally be a red flag for our economy. This time around, the slack is being papered over by the Fed, which is creating money out of thin air in order to buy what is, in essence, most of the new debt being issued by the federal government. By filling the gap left by exiting foreigners, the Fed has been able to sustain low interest rates—for the time being. 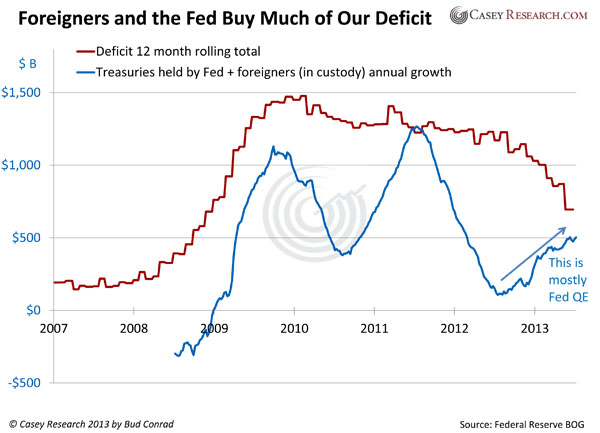 As the American public doesn't save much, and because foreigners are stepping away from US government debt, the Fed is left as the buyer of last resort and will have to keep up its QE.
Among a number of problems, the money creation required for the Fed to serve as the government's lender of last resort can be very inflationary once it ultimately bleeds into the economy. For now, most of the new money has been bottled up on the balance sheet of the Fed. With low rates, that is manageable. But if rates rise, as they eventually must in the face of rising inflation and a loss in confidence in the dollar, the interest the Fed pays on deposits rises as well, putting the viability of the institution at risk. In addition, as rising rates increase the cost of servicing the government's many debts, federal deficits will also rise. And that has the very real potential to create the equivalent of an economic death cycle as foreigners, and pretty much anyone other than the Fed, rush to the exits on US government paper, causing interest rates to rise further. While it is impossible to say with any certainty when the US government bond bubble, the largest in history, will burst, the recent up-moves in interest rates should serve as a clear warning shot. From the charts, it looks like the foreigners have taken notice.
Investors relying only to future growth in stock prices for their returns were badly burned as they saw their portfolios decimated by the dot-com bust and the Great Recession. Those investors holding portfolios with an even mix of dividends and growth were certainly not immune, but they could at least look to past cash returns for overall performance. On average since 1962, the market has suffered crashes of more than 20% in a year once every seven and a half years. Still, investing is about long-term returns, and even the best dividend stocks may not get your portfolio to its goal. So what's an investor to do? The answer lies in a group of stocks that Financial Analyst Paul Tracy calls "Forever Stocks." These are the stocks that you can confidently hold forever, collecting your dividend checks and banking the higher share price when you need it. These are the companies with strong cash flows that support a current cash return but can increase the share price over time. Problem is, these stocks don't come around often. Most companies with stocks yielding around 3% or higher often do not keep enough cash to reinvest into their business. Utilities and telecoms are good examples. Both industries are heavily regulated, and these companies pay out much of their free cash flow, leaving only enough for maintenance capital expenditures. In fact, only about 3% of companies with shares trading in U.S. markets pay better than a 3% dividend and still enjoy a return on equity of 15% or higher. For some "Forever" equities, you have to look beyond the U.S.' borders. Despite the recent sell-off in emerging-market shares, this is really where investors will find future growth. Europe might eke out growth in the fourth quarter, if it's lucky, while the U.S. and Japan are doing everything they can for a target of just 2% growth on the year. Down from the decade average around 7%, emerging markets are still forecast to post 5.5% growth this year. Though the emerging-market space has underperformed this year, it should be a fairly short-lived weakness. One of the biggest culprits to the underperformance in emerging-market stocks has been a decrease in profitability with higher labor costs. Increases in minimum wage rates across the group have brought return on equity from a peak of 15.7% in 2011 to 12.9% this year. Even at this lower level, the group still outperforms others like Europe (10.9%) and Japan (6%). As the developed economies recover to normalized levels and exports pick up, the emerging markets will see a faster rebound. The problem is that many emerging-market indexes, and the funds that follow, are constructed according to the market capitalization of the constituent countries, so larger markets make up a bigger weight. This means that markets that have been successful in development and may be on the verge of developed-nation status will hold bigger weights. The solution... An emerging-market fund that weights countries by fundamentals and dividends rather than market capitalization. The WisdomTree Emerging Markets Equity Income Fund (NYSE: DEM) rebalances each year based on dividends and earnings of the universe of tradable emerging-market stocks. Companies must have a dividend yield in the top 30% of those in the WisdomTree Dividend Index (WTDI) and trade at least a quarter-million shares per month to be considered for inclusion. The fund of 350 companies pays a 3.3% dividend yield and has beaten 98% of its peers over the past six years. The weighting on fundamentals gives the fund a value tilt since higher price-to-earnings stocks are dropped in favor of those with high dividends and lower prices. The fund, at $5.5 billion, is the largest of the WisdomTree emerging-markets lineup with overweight exposure to energy, materials and telecom. The biggest difference between the fund and others in the emerging-markets space is its huge underweight exposure to South Korea, which makes up just 2.9% of the index, compared with 14.3% in the MSCI Emerging Markets Index. The value tilt and focus on dividends has worked. Since its inception in 2007, the fund has beaten the MSCI Emerging Markets Index by an average of more than 5% a year. Even more impressive is the fact that volatility in the shares is lower at 23% versus 28% in the popular emerging-markets index. Most of the fund's holdings are not directly available to U.S. investors, making the exposure even more valuable in my opinion, but some -- such as Chunghwa Telecom (NYSE: CHT), a $25 billion integrated telecommunications company in Taiwan -- are traded as American depositary receipt (ADR) shares. CHT pays a 3.6% dividend yield and has returned a compound rate of 14% annually over the past five years. Another standout of the fund, Banco de Chile (NYSE: BCH), is a $13.8 billion financial institution in Chile with a 4% dividend yield and a compound return of 22% annually over the past five years. This graphic shows the relative country and sector weightings in the fund. As with most emerging-market funds, Russia, China and Brazil make up a large portion of holdings, but the fund underweights other markets like South Korea with its questionable emerging-markets credentials. 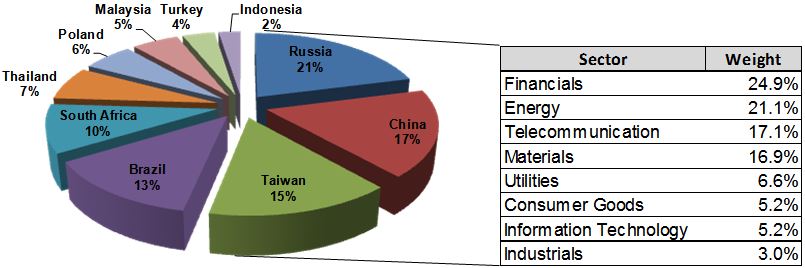
Outlook
The recent talk of tapering massive liquidity programs by the Federal Reserve has seen a rebound in the dollar and added to emerging market weakness. Still, debt levels topping 100% of GDP in the United States and other developed nations means that long-term growth may never return to its past levels. Return on equity is what drives long-term performance in shares and the emerging world is the only place to provide the kind of returns you need to meet your financial goals. The fund trades for just 10 times the underlying earnings of the companies held, compared with 11 times for the iShares MSCI Emerging Markets (NYSE: EEM) and 16 times for companies in the S&P 500. If valuations rebound closer to their 20-year median of 15 times trailing earnings, the shares could bounce 50% off of current levels. Even if a return to historical levels is not in the cards, GDP growth in emerging markets of 5.5% should yield earnings growth of around 7.5% and $5.13 per share for companies in the fund. A price multiple of 12 times earnings puts the fair value at $61.56 per share, a gain of 23% on top of the 3.3% dividend yield. Risks to Consider: Weakness in the global macroeconomic environment as well as strength in the dollar could hold shares down in the short term. The real risk is getting anxious during periods of higher volatility and selling out of a "Forever" investment at low prices. Action to Take --> The U.S. faces a few years of very good growth relative to other developed markets, but emerging markets may be a better investment for the long term. The WisdomTree Emerging Markets Equity Income Fund provides exposure to this growth while generating a stable dividend stream. The fund breaks the mold with its re-balancing on fundamentals and should continue to outperform other emerging markets options.
A recent article by Joseph Hogue on the "hated" company Philip Morris (NYSE: PM) reminded me of the incident at the ballpark. I learned that despite this company's leading position in a pariah of an industry, it is held by nearly 1,400 institutional funds and has consistently outperformed the market. This revelation sparked my interest in looking behind Philip Morris for other top-performing companies in the tobacco industry. Over the years, I have learned that for every successful and popular stock, there are usually several under-the-radar companies that are also thriving on the success of the well-known name. These companies can be competitors, partners, or critical links in the supply chain. My digging revealed a quality dividend-paying stock that's part and parcel of Philip Morris's supply chain. Although it is nowhere as well known as Philip Morris, this company plays a critical behind-the-scenes role in Philip Morris' success. The company is Universal Corp. (NYSE: UVV), a Richmond, Va.-based tobacco merchant and processor with operations in more than 30 countries. Working directly with manufacturers of tobacco-based products, Universal specializes in the financing, selection, processing and storage of leaf tobacco. Founded in 1918, the company boasts a market cap of nearly $1.5 billion and a forward price-to-earnings (P/E) ratio of just over 12. Universal just posted improved annual results with net income rising 44% to nearly $133 million from last year and operating income up 4% to close to $233 million on revenue of $2.5 billion. The company currently pays a quarterly dividend of 50 cents, which equates to a yield of about 3.5%. The company has increased its dividend for 42 years in a row, making for an enticing long-term investment. Universal's customers include Philip Morris, British American Tobacco (NYSE: BTI) and Imperial Tobacco (OTC: ITYBY). It has been able to maintain its profits by sourcing tobacco to meet demand. In other words, most of its inventory is already committed to sale. This intelligent strategy helps insulate Universal from the pressure of commodity price risk. 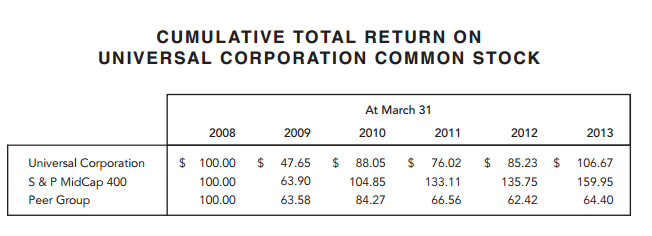
As you can see, Universal has outperformed its peer group over the past five years. Universal isn't a fast-rising growth stock, but it is a solid, dividend producing company that deserves a place in every long term dividend growth portfolio. 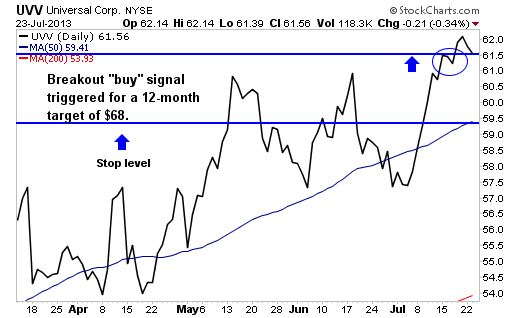
Technically, shares have been trending up from a double bottom formed in April. Price has set up to be an ideal buy as a breakout entry above $61.50. My 12-month target price is $68 with an initial stop level at the 50-day simple moving average of $59.50.
Risks to Consider: Despite its strong performance, Universal remains in a pariah industry. As seen in the United States, consumer tastes can rapidly change, and possible governmental regulations and anti-smoking measures could damage profits. In addition, it's important to note that leaf tobacco usage has been slowly declining. Although the company's inventory methods work to reduce commodity price risk, this risk still remains as a possible headwind. Action to Take --> I like Universal right now as a long-term investment. Always remember to use stops and that diversification is the key to consistent stock market profits.
The U.S. economy is growing slowly at best, while the European economy is still contracting. European consumer confidence is still very low, and housing markets are worrisome. The average European is cutting back on their expenditure and is rather saving money than spending it. This means that companies relying on these markets for much or all of their revenue can do little more than cut costs and protect market share. If you're a large company that wants to grow even larger, you need to be present in the emerging markets. The so-called BRIC countries (Brazil, Russia, India and China) and many other developing economies are growing at a fast clip. They have young, dynamic populations that are working hard and growing wealthier every year. But rather than risk your money by investing directly in these volatile economies, why not hedge yourself with exposure to developed and emerging-market economies using one investment? This is one reason I like Anglo-Dutch food and personal-care giant Unilever (NYSE: UN). Founded in 1930, Unilever is the world's third-largest consumer goods company (after Procter & Gamble (NYSE: PG) and Nestle (OTC: NSRGY)) and the world's largest maker of ice cream. Unilever has nearly 400 brands in its portfolio of foods, beverages and personal care products. It owns several billion-dollar brands, including Ben & Jerry's, Dove, Lipton and Wish-Bone. When it comes to taking advantage of both the stability of developed markets and the growth potential of emerging markets, Unilever's management is fully aware of the opportunity. Sales in developed markets have grown marginally in recent years, with profit margins stabilizing above 14%. In contrast, sales in emerging markets surged 11.4%. Sales in emerging markets already count for 56% of Unilever's total sales, and at the current growth rate, Unilever will be less dependent on the stalling developed markets. Sales in Asia, the Middle East, Turkey, Africa, Russia and Ukraine have surged by almost 10% a year since 2003 to an annual total of $37 billion. Unilever is expanding its 52% stake in Hindustan Unilever (its India-based operations) to 75% to capitalize on India's fast-growing middle class. Analysts expect Unilever to grow another 6% to 10% this year due to its strong presence in the emerging markets. Even better, while most investors might be tempted to go with a stock like Procter & Gamble as a play on this thesis, I think Unilever is a better opportunity for investors. For starters, it isn't as well known to U.S. investors as Procter & Gamble. That puts it under the radar -- exactly where I like my investments. I find that the less well-known an investment is, the better my chances of making market-beating gains before the crowd catches on (provided the idea is good and the company executes, of course). In comparison, the case is clearly in Unilever's favor. Procter & Gamble's sales grew only 3% last year while Unilever's growth was 10.6%, thanks to its strong presence in the emerging markets. Another reason for preferring Unilever over Procter & Gamble is Unilever's ratio of net debt to EBITDA (earnings before interest, taxes, depreciation and amortization) is only 1.1, which means there is enough room for capital investments and share buybacks. Also in Unilever's favor is the aggressive growth path that management has introduced. The target is to double sales and increase its social impact while reducing the environmental footprint. Unilever has been chosen as sector leader in the Dow Jones Sustainability Index for the 14th consecutive year. Unilever's price-to-earnings (P/E) ratio has is nearly 20 (compared with P&G's 18.4), but its strong growth prospects fully justify this. Most of Unilever's solid brands have hardly been hit during the financial crisis. Only sales in Europe declined, but that has been more than compensated by the stormy growth in emerging markets. One very important factor for Unilever is the cost of raw materials. Palm oil, coffee and sugar are ingredients used in many of its products. Last year, Unilever had to take a one-time charge-off of $2 billion because of higher-than-expected soft commodity prices. This year, commodity prices have been declining. Most commodities peaked in the summer of 2011 and are still sliding, albeit slowly. Sanford Bernstein analysts estimate that Unilever's core operating profit could rise 30 basis points to 14%. But the price of sugar is coming down, and that is good news for Unilever. Of course, like all food companies, Unilever is continuously hedging the swings in raw materials, but the trend is down, which should benefit its margins. 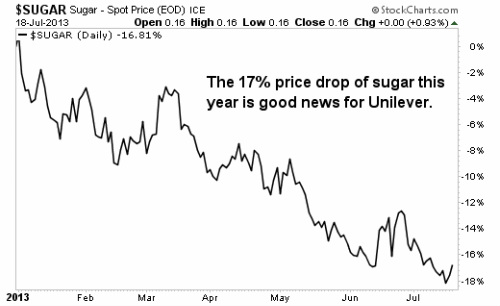
Unilever is not a stock you should buy for a quick scalp. It is a defensive investment that provides its shareholders with a nice dividend each year. Unilever's dividend yield is currently 3.4%, but it has grown by 30% since 2009.
Risk to Consider: Rising commodity prices could hurt Unilever's profit. Slight price increases could easily be passed on to consumers but bigger movements could be costly. Action to take --> Unilever is growing fast in the emerging markets, and commodity costs are declining. This makes Unilever a great defensive stock to add to your portfolio.
Today's chart shows that it's still a big "stealth" bull market in biotechnology. Regular readers know we see biotechnology as one of the market's greatest "boom and bust" sectors. With its promise of individualized medicine, cancer cures, and miracle drugs, the biotech sector easily captures imaginations and huge speculative money flows. If you catch a good biotech boom, you can make extraordinary gains. Like most assets, biotech stocks were hammered in the 2008-2009 credit crisis. But as you can see from today's chart, biotech is enjoying a big trend. You can track the biotech sector with the Nasdaq Biotechnology Index. It's sort of the "Dow Industrials of biotechnology." This index bottomed at around 650 in 2009. Since then, it has strung together a series of "higher highs and higher lows" to advance 200%. This month, it reached a new multiyear high. This uptrend isn't making big news yet... but it will. 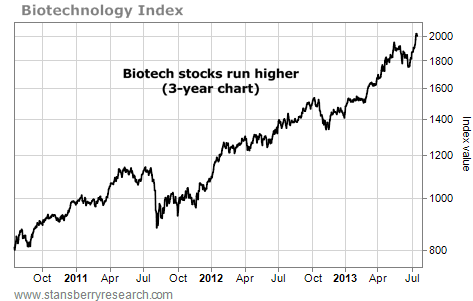
According to 13F filings, Billionaire T. Boone Pickens has taken a sizable position with the following companies: Apache (NYSE: APA), Tesoro (NYSE: TSO), Marathon Petroleum (NYSE: MPC), Gulfport Energy (Nasdaq: GPOR) and Phillips 66 (NYSE: PSX). As you might expect, these stocks have all done well this year. Gulfport has seen the biggest gains, up 28%. The only laggard of the bunch is Apache, up "only" 8%. So, considering the big gains we've already seen in this sector, are any of these picks still a good investment at today's prices? While I strongly believe all five companies should remain on investors' short list of stocks to watch, I think Phillips 66 offers the best value at today's prices. Phillips' strength lies in the diversification of its assets. Although it is known primarily as a refiner, the company also owns interests in pipelines and chemical assets that help boost earnings and provide stability, and help to differentiate the company from its peers. As part of a joint venture with Spectra Energy (NYSE: SE), Phillips owns a 50% interest in DCP Midstream Partners (NYSE: DPM). DPM owns or operates 62 natural gas processing facilities and 12 NGL fractionation plants. And it services these facilities through its massive, 62,000 mile natural gas pipeline system. If you read my postings on LNG and MLPs, you are probably already familiar with my fondness for "irreplaceable" assets like pipelines. These assets are very difficult to replicate, which discourages competition and helps maximize profits. Brookfield Infrastructure (NYSE: BIP) is up more than 48% since my earlier recommendation. In addition to its position in DPM, Phillips holds other midstream assets, including a 25% interest in the REX pipeline and investments in fractionation plants. Although Phillips has been publicly traded only since May 2012, it has already increased its dividend twice. It currently pays a rate of 31 cents a share, which comes out to a yield of 1.78% at today's prices. The company's core refinery business also continues to churn out profits. Phillips operates a total of 15 refineries, 11 of which are in the U.S. It also operates one refinery in each of Malaysia, Germany, the U.K. and Ireland. (In fact, the Whitegate plant in Ireland is the only refining facility of its kind in that country.) The amount of free cash flow the company generates has grown enormously over the past three years. During the past 12 months, PSX reported almost $5 billion in free cash flow, a fivefold increase over the $946 million reported in 2010. Free cash flow is an important metric to consider because it indicates that a company has cash to expand, develop new products, buy back stock and pay dividends. Rising free cash flow is a good indicator of a healthy, thriving company. T. Boone Pickens is not alone in his fondness for PSX. Warren Buffett's Berkshire Hathaway (NYSE: BRK-B) owns over 27 million shares of the company -- an investment of more than $1.9 billion. As they say -- great minds think alike. Risks to Consider: In December, PSX announced it would form a master limited partnership (MLP) sometime in the second half of this year. Transportation and terminal assets typically do well as MLPs, and some of these assets are likely to be the foundation for Phillips' new entity. However, if PSX decides to consolidate all or some of its pipeline assets into an MLP, it could damage diversification and reduce one of the company's key advantages. Action to Take --> PSX is currently trading at a forward price-to-earnings ratio of 7.4 and a price-to-book ratio of 1.8, both of which are slightly lower than the industry average. The stock rates a buy below $60 per share. Much like Phillips 66, Brookfield Infrastructure deals in long-lived, irreplaceable assets and we thinks Brookfield's headed for big things in the coming years. Supply and demand is what drives the global economic engine. Imagine owning a company whose products and services have nearly guaranteed steady demand and government-regulated supply. Add in the beauty of government-supported monopoly-like power and steady dividend yields and you've attained investor nirvana. Although these companies may be considered boring and overlooked by investors seeking rapid capital appreciation, they remain an ace in the hole for long-term stock investors. If you haven't guessed, I'm talking about utility stocks. Despite a recent pullback, these consistent and proven dividend machines are ideal "buy" candidates for any long-term portfolio. With this in mind, here are my two favorite utility stocks: Southern Co. (NYSE: SO) A leading U.S. provider of electricity, this large-cap public electric utility has a market capitalization of more than $38 billion and boasts a price-to-earnings (P/E) ratio of nearly 19. Southern has subsidiaries in four states, including Mississippi Power, Georgia Power, Gulf Power and Alabama Power. The company's beta is -0.10, meaning it's nearly as volatile as the overall market, and its stock currently yields more than 4% annually. Profitability has increased from close to $2 billion in 2010 to more than $2.1 billion in 2012, indicating an enhancement of more than 4%. 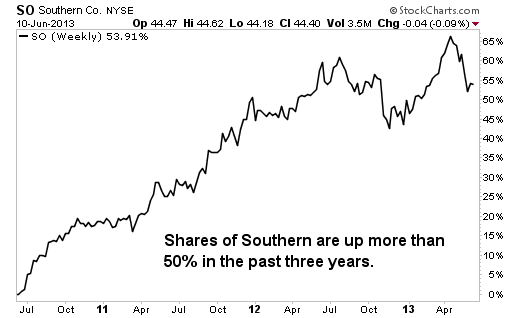
Southern has plans to invest $14 billion over the next several years to increase transmission and power-generating capacity. In addition, the company is targeting earnings growth of 5% to 7% for each of the next five years. What I like best about this utility is the fact that Southern investors are enjoying much faster dividend growth than the majority of other utilities. The company has grown at an astounding rate of 40% over the past 10 years, yet the payout ratio remains at less than 30% of cash flow, which means future dividend growth is probable. Presently throwing off a forward annual yield of 4.6%, this utility is an excellent prospect for long-term investors. Duke Energy (NYSE: DUK) The largest electric company in the United States, Duke provides electricity to more than 7 million homes in the Carolinas, the Midwest and Florida. The company also provides natural gas distribution services in Ohio and Kentucky, as well as diverse power generation and renewable-energy assets in Latin America and North America. Over the past three years, Duke's net profits have increased from roughly $1.3 billion in 2010 to more than $2.1 billion this year. The company currently boasts a beta of 0.08 and an annual yield of 4.5%. 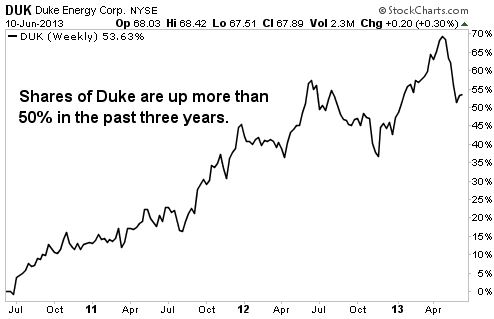
Risks to Consider: Utilities are widely considered to be among the safest, best-yielding stock investments available. However, a recent study has made it clear that utility stocks may actually be more volatile, as a whole, than the overall stock market. While this in no way negates the power of utility stocks as dividend-producing machines, it shows that utilities may share similar risks as the rest of the stock market. As always, choose your investments carefully and be sure to diversify. Action to Take --> On the daily technical chart, Duke and Southern appear nearly identical. They have followed a lockstep pattern of falling from the highs, breaking below the crucial technical support of the 200-day simple moving average, then bouncing back above resistance, setting up an ideal buying level. My 12-month targets are $75 for Duke Energy and $50 for Southern. You would think a master limited partnership (MLP) that has outperformed its industry peers by 88% and the Nasdaq by 34% in the past five years -- while yielding an average of 8.8% -- would be well-known to investors but this MLP flies under the radar. No Wall Street analysts follow this company, and institutions hold only 11% of its shares. However, if you're looking for a profitable high yielder poised for growth from rising energy prices, this is a name you should know. The stock I'm talking about is Dorchester Minerals (Nasdaq: DMLP), an energy MLP formed in 2003 through a merger of three smaller companies. Dorchester generates revenue from royalties it collects from the oil and gas wells on its properties, which total 3 million acres spread across 25 states. Dorchester has exposure to many of North America's most prolific gas fields, including the Fayetteville Shale, the Bakken formation, the Appalachian Basin, the Barnett Shale, the Permian Basin and the Granite Wash. Perhaps best of all, only about 30% of Dorchester's holdings are developed. That adds to the potential for a rising income stream as new wells are drilled. Unlike conventional oil and gas drillers, Dorchester has no exposure to the costs and risks of exploration, development and production. Instead, the company collects a royalty based on the sales volume of each well after the driller recoups 150% of well expenses because royalty payments are directly affected by the selling price of natural gas. Dorchester generates more cash flow when natural gas prices are rising. Dorchester also differs from many of its MLP peers in that its general partner's fee is fixed at 4%. There are no distribution rights or incentives that increase the general partner's percentage on higher profits. Dorchester unit holders can count on consistently collecting 96% of the MLP's cash flow. The improving outlook for natural gas demand and prices means this may be an especially good time to own Dorchester. Futures prices for natural gas surged to a 20-month high in April in response to an unusually cold spring that drained stockpiles. This prompted Goldman Sachs to raise its outlook for 2013 natural gas prices by 17%. 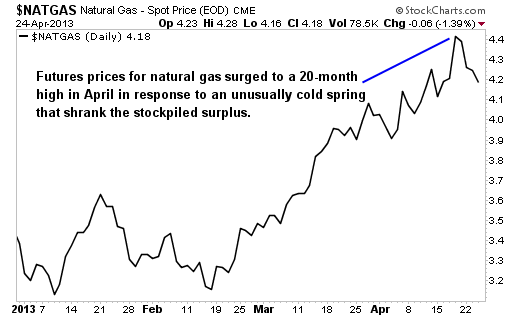
Natural gas accounts for roughly 75% of its reserves. Historically, Dorchester has been able to offset production declines from a steady stream of new wells on its acreage. During 2012, 490 new wells were completed on the MLP's properties. Despite low natural gas prices that led to reduced drilling activity in many of the company's producing areas, Dorchester produced respectable results in 2012. Revenue fell 9% from a year earlier to $63.2 million, but that was still the second-highest in four years. Net income was $38 million or $1.20 a share, down only 10% from a year earlier. Despite its reduced earnings, Dorchester's cash flow actually improved 2% in 2012 to $56.4 million from a year earlier, and the MLP paid distributions of $1.79 a share to unit holders, an 8% increase over 2011. Dorchester ended 2012 with cash of $13.8 million and no long-term debt. In fact, the company's charter precludes Dorchester from taking on long-term debt. But even without the benefit of leverage, Dorchester has been able to consistently produce returns that exceed its industry peers. In the past five years, Dorchester's operating margins have averaged 62%, which is more than four times the average 15% margin of its industry competitors. Dorchester's five-year average return on assets is 28%, nearly three times its peer group average of 10%. Company insiders show their confidence in Dorchester's future prospects by owning a healthy 9% of shares. Another sign of management's confidence is a 3.5% increase in the distribution, to 45 cents a share. Since 2009, Dorchester has increased its annualized distribution 19%. Consensus analyst estimates forecast 5% earnings growth for Dorchester's industry peers this year, accelerating to 6% next year. I think it's likely that Dorchester can beat that estimate, thanks to its unhedged exposure to further increases in natural gas prices. Risks to consider: Dorchester typically pays out 87% of operating cash flow as distributions. However, the amount may fluctuate due to the volatility of natural gas prices. For example, Dorchester's distributions dipped from $2.80 in 2008 to $1.50 in 2009 before rising to $1.65 in 2010 and $1.79 in 2012. Some income investors may find the variability of Dorchester's distribution too risky. Action to take --> Dorchester is an appealing stock for investors who want generous income and exposure to rising energy prices. I like this MLP because of its industry-leading profitability, low-risk profile, significant land holdings and untapped reserves. MLPs, thanks to their unique corporate structure, can create a headache at tax time. Each MLP issues a K-1 tax form at year end, and if you own a half-dozen of them, then that's a lot of paperwork to sort out. Yet there's a simpler way. Instead of constantly searching for the most attractive MLPs, why not keep it simple and own an investment that does all the tax work for you? The JPMorgan Alerian MLP Index ETN (NYSE: AMJ) does just that. This is an exchange-traded note (ETN), not an exchange-traded fund (ETF), but the distinction doesn't really matter (unless the ETN issuer defaults on that note, which has never happened, as far as we know). Yet it's the ETN tax structure that saves you headaches during tax time. JPMorgan Chase (NYSE: JPM) actually owns the stocks in this ETN, and you simply invest in JPMorgan's debt instrument. At tax time, there's no K-1 to worry about. Moreover, if this ETN were structured as an ETF, it would generate corporate taxes, which would take a roughly 5% bite out of profits. Yet the greatest appeal of this ETN is its rock-steady performance. Year after year, it rises in value as more pipelines get built and higher industry dividends are paid out. In fact, this note has risen an average of 20% over the past three years while generating below-average risk. That's why Morningstar gives this note five stars. 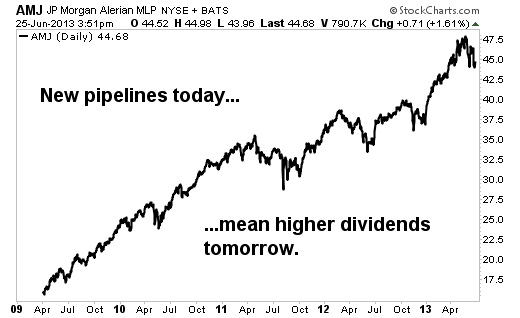
Indeed, we've discovered over time that these MLPs not only deliver solid share price gains, but also deliver more robust yields when compared with other yield-focused asset classes. According to Bloomberg, the average bond ETF yields 2.16%, the average utilities ETF yields 3.52%, and the typical REIT ETF sports a 3.55% yield. In contrast, the Alerian MLP ETN's yield currently exceeds 4.5%. To be sure, the note has a few drawbacks, starting with a 0.85% expense ratio. Thankfully, the 20% annualized gains have made that expense load bearable, but if annual returns are smaller in the future, then those expenses will take a seemingly deeper bite. Also, like all yield plays, shares may suffer if interest rates keep rising and investors pivot back to fixed-income investments. Indeed, this ETN is off nearly 7% in the past month as interest rates have risen. Yet a still-slow U.S. economy is likely to cap further interest rate increases in the near term. Risks to Consider: You can probably find MLPs with greater yields if you are willing to dig more deeply, but understand that higher yields signal less safety. Action to Take --> The Alerian MLP ETN offers a compelling combination of share price appreciation, rock-solid yields and very low risk. The Philippines has been transitioning from an agricultural economy to one more focused on services and manufacturing. Its political stability, youthful workforce and prevalence of English are ideal for companies already setting up business process outsourcing centers there. And the trend isn't slowing down. One of my favorite plays in this country is a high-yielding telecommunications company, PLDT (NYSE: PHI). Established in 1928, the Philippine Long Distance Telephone Co. is the largest telecom in the Philippines and one of its largest and most traded stocks. The company has been strong in recent years, increasing revenues annually. Its policy is to declare a regular dividend of 70% of core earnings per share and a special dividend whenever possible. It has EBITDA margins of 46%, a price-to-earnings ratio of 17 and a cash dividend yield of 5%. PLDT has three operating segments: wireless, fixed line, and Internet and communications technology. Nearly 60% of the Philippines' population owns cellphones, and the wireless segment is PLDT's core business. A 10% increase in wireless subscribers brought its share of the country's mobile market to 68% at the end of 2012. The company's wireless revenues grew at an industry-leading 15% during the year. PLDT's fixed-line division focuses on data and other network services, as well as information and communications infrastructure and services for Internet applications. The company's Internet and communications technology division has focused on business process outsourcing and communications infrastructure; it also provides services for Internet applications and multimedia content delivery In its most recent quarter, the company reported adjusted net income of $189 million, with operating cash flow increasing to $646 million. Gross profits increased to $3.4 billion from $3 billion in 2011, and net income was up 20%, to $862 million. 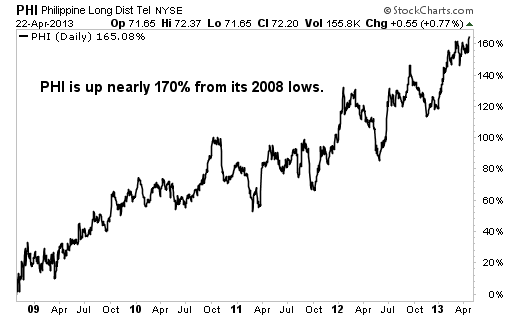
Risks to Consider: Foreign exchange risk is at play with international stocks, and currency fluctuations could impact returns. With 88% of its debt priced in U.S. dollars, depreciation against the peso could impair profitability because of higher interest payments. With 50 million mobile phone subscribers in the Philippines, the market is approaching maturity. As a result, the company's growth will come to a screeching halt unless it stays innovative. Action to Take --> With a solid, growing dividend of 5%, PLDT is a good buy up to $75. This stock has seen tremendous growth in the past decade, and I think the best is yet to come. A gain of more than 25% in the next 12 months wouldn't surprise me. I hope that you will take these recommendations to heart and climb aboard the dividend train to a prosperous future and a millionaire lifestyle. 
RICH & HAPPY!
This state of indecision is usually permanent, and often continues until you hear the all too familiar phrase, "Well, it's too late to sell now." One of my good friends lost it all following the "it's too late to sell now" principle. He bought a ton of shares in a cable company based on his friend's recommendation that it was supposed to take over the world. The shares soon tumbled in half, and his friend, who knows about the cable business, told him to buy more, so he did. The shares tumbled in half again, and he bought even more. He finally stopped buying when the shares hit a dollar a share. The shares eventually traded for pennies. After you've read today's essay, if you follow the advice in here, your constant state of indecision will be gone. You'll never lose another night's sleep worrying about which way your investments will go tomorrow. Because, unlike most investors, you'll have a plan – knowing when to get out, and when to stay in for the biggest possible profits. Buying stocks is easy. There are thousands of theories out there for why and when to buy. But buying is only the first half of the equation when it comes to making money. Nobody ever talks about the hard part – knowing when to sell. In order to invest successfully, you need to put as much thought into planning your exit strategy as you put into the research that motivates you to buy the investment in the first place. So please read closely here, and think about each point. How Do You Evaluate Businesses? In business and in stocks, you've got to have a plan and an exit strategy. When you have one, you know in advance exactly when you're going to buy and sell. The strategy I'm going to show you will allow you to ride your winners all the way up, while minimizing the damage your losers can do. But before I get into the specific strategy, consider this business example. Let's say you're in the tee-shirt business. You've made a ton of money on a tee-shirt business in the States, and you're now in the Bahamas looking for new opportunities. You size up the market, and you figure you can make money in two markets: in golf shirts, geared at the businessman, and in muscle-tees, geared toward the vacationing beach-goers. These are two products clearly aimed at two different markets. You invest $100,000 in each of these businesses. At the end of the first year, your golf shirts are already showing a profit of $20,000 but the muscle-tees haven't caught on yet, and you've got a loss of $20,000. There are numerous reasons why this is possible, so you make some changes in your designs and marketing and continue for another year. In the second year the same thing happens – you make another $20,000 on your golf shirts, and you lose another $20,000 on your muscle-tees. After two years, the golf shirt business is clearly succeeding, and the muscle shirt business is clearly failing. Now let's say you're ready to invest another $100,000 in one of these businesses. Which one business do you put your money into? The answer should be obvious. You, as a business owner, put more money toward your successful businesses. But as you'll see, this is the opposite of what 99% of individual investors in America do. How Do You Evaluate Stocks? Let me start by asking you a question – what does "owning shares of stock" actually mean? This isn't a trick question – as you know, it means you're a partial owner of the company, just like you're the owner of the tee-shirt company in this example. Owning your own business isn't fundamentally any different than owning a share of a business through stock. However, most people treat them exactly the opposite. Let's say the shares of your two tee-shirt companies trade on the stock exchange. They both start trading at $10 a share. At the end of the first year, the profitable golf-shirt company is trading for $12 a share, and the unprofitable muscle-shirt company is trading for $8 a share. At the end of the second year, the golf shirt company is trading at $14, while the muscle shirt company is trading at $6 a share. Which shares would you rather own? Even though you know you should buy the winning concept based on the business example, most investors don't do so in their stock investments. They keep throwing good money after bad hoping for a turnaround. They buy the loser. The Trailing Stop Strategy In stocks (and in business, I believe), you must have and use an exit strategy – one that makes you methodically cut your losses and let your winners ride. If you follow this rule, you have the best chance of outperforming the markets. If you don't, your retirement is in trouble. The exit strategy I advocate is simple. I ride my stocks as high as I can, but if they head for a crash, I have my exit strategy in place to protect me from damage. Though I have many reasons I could sell a stock, if my reasons don't appear before the crash, the Trailing Stop Strategy is my last ditch measure to save my hard-earned dollars. And it works. The main element to the Trailing Stop Strategy is the 25% rule. This is where I will sell any and all positions at 25% off their highs. For example, if I buy a stock at $50, and it rises to $100, when do I sell it? If it closes below $75 – no matter what. Don't Let Your Losers Become Big Losers So with my Trailing Stop Strategy, when would I have gotten out of the failing muscle-shirt business? You already know the answer. Remember, the shares started at $10 and fell immediately. Instead of waiting around until they fell to $6 as the business faltered, using my 25% Trailing Stop, I would have sold out at $7.50. And think of it this way – if the shares fall to $8, you're only asking for a 25% gain to get back to where they started. But if the shares fell to $5, you're asking for a dog of a stock to rise 100%. This only happens once in a blue moon – not good odds! Take a look at how hard it is to get back to break even after a big loss...  So what's so magical about the 25% number? Nothing in particular – it's the discipline that matters. Many professional traders actually use much tighter stops.
Ultimately, the point is that you never want to be in the position where a stock has fallen by 50% or more. This means that stock has to rise by 100% or more just to get you back to where it was when you bought it. By using this Trailing Stop Strategy, chances are you'll never be in this position again.
The days right before and after Independence Day tend to lean bullish. So lots of folks are expecting this to be a good week for the stock market. And following yesterday's big gain, we're off to a good start so far. But there are a couple reasons to be cautious. In fact, any gains this week may lead to weakness next week. Let me explain... The two indicators we use to call for a short-term rally in stocks are now neutral. Any further progress this week is likely to have them pointing to a short-term decline. Take a look at this chart of the McClellan Oscillator plotted alongside its Bollinger Bands. 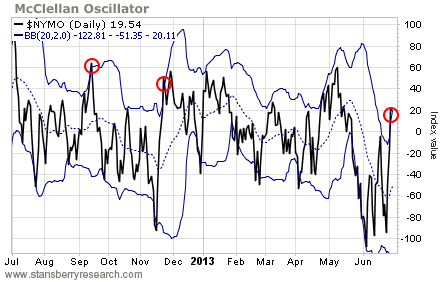 Last Thursday, the McClellan Oscillator closed above its upper Bollinger Band – which indicates an extreme move. This is an early warning sign that any additional gains in stock prices in the days ahead are likely to be given back. Here's how the S&P 500 traded after the McClellan Oscillator popped above its upper Bollinger Band last September and November. 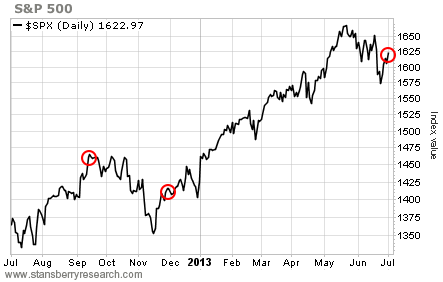 Stocks didn't fall right away. In fact, in December, the market actually posted solid gains. But those gains were short-lived as stocks relented to the overbought conditions. Here's another reason to be cautious of a rally this week. 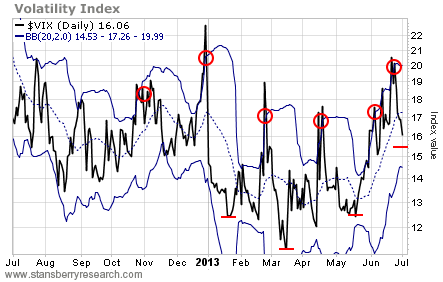 The Volatility Index (the "VIX") triggered a buy signal in stocks two weeks ago by closing above its upper Bollinger Band and then dropping back below it. This confirmed our buy signal.
The VIX dropped rapidly following the three previous buy signals this year. But it never reached its lower Bollinger Band before reversing and heading higher again. A rising VIX typically coincides with a falling stock market. Any additional gains in the market this week are likely to push the VIX down toward the 15 level. That move would match the action following previous signals. It would likely mark at least a short-term bottom for the Volatility Index and a short-term top for stock prices. |


 RSS Feed
