The Millionaire Maker Investment Advisory
  • Introduction
  • Market Conditions
  • Commodities Corner
  • Featured Interview
  • Understanding Markets
  • Understanding Money
  • Understanding Value
  • The Tax Shelter
  • Retire Rich
  • Radio Blog
  • Contact

This Year's Best Timing Indicator Now Says "Sell"

10/22/2013

0 Comments

 
Picture
MARKET CONDITIONS


The stock market is overbought and primed to reverse lower according to one of this year's most accurate market timing indicators. The NYSE McClellan Oscillator (NYMO) is a measure of overbought and oversold conditions in the stock market; and its performance has been outstanding this year.

We've used the NYMO to trigger several profitable short-term trades. Right now, it's triggering another one. The NYMO warned us stocks were overbought in mid-July and mid-September. That gave aggressive traders the chance to profit from a couple short trades as the S&P 500 fell more than 60 points within just a few weeks of each trigger. 

The NYMO also warned us when stocks were oversold and primed for a rally. We got "buy" signals in early June and late August. Each of these signals led to big rallies and profits for traders who jumped onboard.   Just two weeks ago, the NYMO triggered another "buy" signal. And the S&P 500 is up nearly 100 points since then. 

There's no doubt that the NYSE McClellan Oscillator has been one of the best timing indicators of the year. So it pays to follow it and right now, this indicator says it's time to sell. Take a look.
Picture
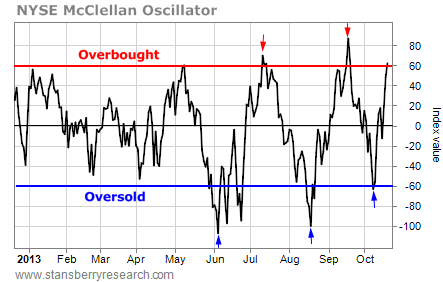
This year, the NYMO has reached oversold levels when it dropped below -60. It was overbought when it rallied above 60. In each of these cases, the stock market reversed almost immediately.

Traders who bet on a reversal made fast profits. Today, with the S&P 500 trading at all-time highs, the NYSE McClellan Oscillator is back in overbought territory. So traders should be on the lookout for a reversal and a chance to profit on a short-term decline in the market. Best regards and good trading,
0 Comments

These 33 Dividend Contenders Could Soon Boost Payouts

10/18/2013

0 Comments

 
Picture
MARKET CONDITIONS

Unlike brokerage “DRIPs,” these allow cash investments of as little as $25. For a list of No-fee company-sponsored DRIPs,
click here.

One of the most gratifying things about compiling the Dividend Champions spreadsheet is witnessing the steady stream of dividend increases, which are announced throughout the year, in wave after wave, by the Champions, Contenders, and Challengers.

(Note that all references to Champions mean companies that have paid higher dividends for at least 25 straight years; Contenders have streaks of 10-24 years; Challengers have streaks of 5-9 years. “CCC” refers to the universe of Champions, Contenders, and Challengers.)

Recent dividend increases have come from Contenders like First of Long Island Corp. (FLIC), Lockheed Martin (LMT), and Microsoft Corp. (MSFT). The only thing better than reporting such increases is knowing ahead of time which companies are going to boost their dividends soon.

Fortunately, the vast majority of CCC companies have a habit of announcing dividend hikes about the same time each year. So it’s no stretch of the imagination to suggest that most of these companies can be expected to repeat this annual phenomenon.

The announcements can come anywhere from two days to more than two months before the Ex-Dividend Date, so I try to look ahead by about 11 weeks to provide adequate “warning” of the good news to come. Currently, that means companies with Ex-Dividend anniversaries through December 31. With that in mind, here are the next group of companies that should boost their payouts, based on last year’s dates:
Picture
No.Yrs=Consecutive years of higher dividends; MR=Most Recent; DGR=Dividend Growth Rate; *Offers Company-sponsored Dividend Reinvestment/Stock Purchase Plan.
0 Comments

3 Pros & 3 Cons On J&J Stock

10/18/2013

2 Comments

 
Picture
MARKET CONDITIONS

Shares have been beating the market so far this year. Shares of Johnson & Johnson (JNJ) didn’t jump much after the company’s earnings report this week but they’ve still been sizzling so far in 2013. Year-to-day, JNJ stock has posted market-beating 31% gains. That isn’t normal for Johnson & Johnson stock, which is usually a pillar of consistency.

Over the past three years, the average annual return for JNJ stock was just under 16%. With that in mind, the obvious question is whether or not JNJ can keep up the momentum. To see, let’s take a look at the pros and cons:

JNJ Pros Global Powerhouse. Every day, over 1 billion people use JNJ products. One reason: Johnson & Johnson has a broad platform, which includes consumer health products, medical devices and diagnostics, along with pharmaceuticals. In fact, the company’s drug portfolio is extensive, covering key areas like immunology, infectious diseases, neuroscience and oncology.

Focus on Innovation. Last year, JNJ shelled out about $7.7 billion for research and development — and so far it’s been getting some nice results. In the latest quarter, global drug revenues for JNJ jumped by 10% to $7.04 billion because of strong sales from offerings like Simponi, Stelara and Zytiga. Unlike many other pharmaceuticals stocks, JNJ has been able to deal with patent expirations by building a strong pipeline. For the cherry on top, JNJ has also been aggressive with acquisitions and collaborations.

Solid Financials. The dividend for JNJ stock yields an attractive 2.9%, while Johnson & Johnson management has increased the payout for a stunning 51 consecutive years. Plus, earnings for JNJ stock have increased for 29 straight years, while the company boasts a AAA credit rating, which only three other companies have. With that in mind, there should be little concern that JNJ will shelling out and bulking up its sweet dividend.

JNJ Cons Headwinds. While the drug business has been strong for JNJ, the consumer products segment has been flat. That’s because it’s a fairly mature industry and the global economy remains dicey. Plus, the even bigger concern for JNJ is its devices business. In the latest quarter, revenues fell by 2%. Once again, the global economy is the main headwind, as patients are not electing to undergo as many surgeries.

Valuation. Shares of JNJ stock are certainly not selling at a discount. The trailing price-to-earnings ratio for JNJ stock is over 20, compared to respective multiples of 8 and 11 for Pfizer (PFE) and Eli Lilly (LLY). And JNJ stock looks frothy based on its forward P/E ratio too, with the current pricetag sitting at nearly 16 times 2014 earnings.

Quality. Over the past few years, Johnson & Johnson has had huge problems with quality control. The result was a spate of recalls. While it looks like the company has been able to get things on track, there is always the risk of more issues. Besides, JNJ still must deal with the resulting litigation, such as for Risperdal (a surgical mesh product).

Verdict JNJ stock is not without issues. As noted above, there are troubling signs with its devices unit and quality control has been a problem. But the good news is that the pharmaceuticals side looks promising for Johnson & Johnson. Plus, the company is planning to launch several new products, which should boost revenue growth and also have juicy margins.

More importantly, JNJ has always been focused on the long term, which has meant that the company has remained a financial powerhouse and continues to sport a nice dividend.

Given all these factors, the pros outweigh the cons on the stock — even after this year’s run-up.

2 Comments

This Once-Shamed Stock Is Blowing Away Google

10/18/2013

0 Comments

 
Picture
MARKET CONDITIONS

All eyes are on Google (GOOG) earnings today, and hardly any eyes are on its financial printer R.R. Donnelley & Sons (RRD) which usually is par for the course, but sure wasn’t one day last year. RRD has doubled Google's YTD gains.

Google stock opened double-digits higher to all-time highs this morning all thanks to a third-quarter earnings beat and soaring revenues. That’s the polar opposite of this time in 2012, when GOOG moved quickly in the opposite direction after the third-quarter Google earnings report.

It was a double-whammy day, as GOOG didn’t just miss expectations on the top and bottom lines, but also accidentally filed its 8-K early. The earnings form featured a line reading “PENDING LARRY QUOTE,” along with other signs that it wasn’t finished.

The result: Google stock plummeted 9% in one day — nearly the same amount it has jumped today — before trading was halted.

And “PENDING LARRY QUOTE” enjoyed five minutes of Internet fame. Of course, Google didn’t just sit back and suffer the mishap alone. It pointed the finger at financial printer R.R. Donnelley & Sons when things went south.

Investors only shamed RRD down 3% on the day of the gaffe, but the headline hangover for the small-cap was much more noticeable. Already sliding R.R. Donnelley & Sons stock fell 16% from the day of Google earnings to 2012′s end, bringing its full-year losses to around 40%.

However, since then, it hasn’t just been Google stock enjoying a rebound … GOOG has just gotten all the headlines (and understandably so). RRD stock has posted a bigger and badder comeback. Take a look:
Picture
RRD shares have fallen off some since peaking in early August, but at 86%, their YTD returns are still blowing away the 38% GOOG stock climb that has captured Wall Street’s attention this year and more this morning. And since last year’s debacle, R.R. Donnelley & Sons stock has soared 56% to beat the 44% return of Google through today.

So sure, Google is getting more publicity but R.R. Donnelley & Sons still can call “scoreboard” for now.
0 Comments

3 International ETFs To Buy Now

10/18/2013

0 Comments

 
Picture
With U.S. stocks hitting all-time highs, it’s probably time to rebalance the global part of your portfolio — and that should mean a dip into some international ETFs. Yes, it has been a great year for U.S. equities, especially compared with the rest of the world. The S&P 500 is up 22% for the year-to-date, a performance that lags only Japan’s Nikkei and the U.K.’s FTSE 100 among the word’s major indices.

Unfortunately, those robust gains have left U.S. stocks looking fairly valued at best — and uncomfortably pricey at worst. That’s why a trip into international ETFs might be the most prudent measure right now.
MARKET CONDITIONS

Market strategists at BlackRock (BLK) recommend clients take some money out of their U.S. positions and reallocate it to foreign developed and emerging markets.

With much of the rest of the world’s bourses underperforming this year, there’s no shortage of overseas equities that are not only cheaper than the S&P 500, but offer much higher yields as well, BlackRock notes.

If you’re looking for ideas, we’ve got a few. We have picked the three most promising international ETFs where the markets are both cheaper than the S&P 500 and offer generous yields. (The yield on the S&P 500 currently stands at 1.9%.) Take a look:


iShares MSCI Australia (EWA)
Total Assets: $2.1 billion
Expenses: 0.53%
Yield: 5.68%

As a major commodities exporter with close economic ties to east Asia, Australia is getting hit hard by the weak global economy — especially the slowdown in China.

Gross domestic product was growing at a blistering annualized rate of as much as 5% before the financial crisis of 2008. Now it’ll be lucky to finish the year with 2%.

That has been hard on Australia equities, but

then, that keeps prices down and yields up. Furthermore, the market’s generous yield makes it easier to wait for these stocks to bounce back.
Picture
The iShares MSCI Australia (EWA) has gained just 2.9% for the year-to-date. Top holdings include Commonwealth Bank of Australia (CMWAY), BHP Billiton (BHP) and Westpac Banking (WBK).

iShares MSCI New Zealand Capped (ENZL)
Total Assets: $147.3 million
Expenses: 0.53%
Yield: 4.3%

A tiny economy closely linked to Australia and Asia, New Zealand equities have held up rather well considering regional sluggishness.

New Zealand’s GDP topped out at a annualized pace of 3.4% in the post-crisis period and has been slowly softening ever since. Forecasts put growth at a tepid 2.4% for all of 2013.

A relatively strong currency isn’t helping exports, but the country is recovering from a drought and consumption is picking up, which points to stronger growth ahead.
Picture
The iShares MSCI New Zealand Capped ETF (ENZL) has managed to scrape out a 13.6% gain for the year-to-date. Top holdings include Fletcher Building (FRCEF), Telecom Corporation of New Zealand (NZTCY) and Auckland International Airport.

iShares MSCI Singapore (EWS)
Total Assets: $1.2 billion
Expenses: 0.53%
Yield: 4.38%

Singapore — a hot market for years — was looking a bit too pricey for new money, but then emerging markets got clobbered over the summer on fears of Federal Reserve tapering.

That has created a better entry point for investors looking for exposure to an economy that’s growing at better than a 5% annualized pace.

True, emerging markets are at the mercy of Fed policy, but between the government shutdown and the new Fed chief being a committed dove, tapering fears have been shelved for now.
Picture
The emerging-market selloff left the iShares MSCI Singapore (EWS) down 0.7% on the year, making it a good time to buy low. Top holdings include Singapore Telecommunications (SGAPY), United Overseas Bank (UOVEY) and Oversea-Chinese Banking.
0 Comments

Stock Is Perfect For A Retiree’s Portfolio

10/17/2013

0 Comments

 
Picture
CEO Tom Fanning
MARKET CONDITIONS


By Steve McDonald

A recent conversation with one of my neighbors has convinced me, when it comes to the small investor, it’s time to take the gloves off. Here’s what she said that flipped my switch. “Should I sell my stocks because of what is happening in Washington? I have done nothing but lose money since 2008 and now I don’t know what to do.”

You have got to be kidding me. This was a buying opportunity, not a reason to sell. And, the worst part is, she is not the exception. She is the norm, 180 degrees out of sync with the market. The small investor always sells into bad news. In this case, it’s the debt ceiling nonsense that has been making headlines.

Don’t worry. I have been at this too long to try to tell you anything as stupid as “buy low and sell high.” After three decades in the markets, I’ve realized probably 98% of people are incapable of doing it.

This is a chronic scenario that is the ruin of most people, especially the little guy. No one has ever tried to total how much buying into rallies and selling on bad news costs the small investor. I imagine it has to be trillions of dollars a year. But here’s a new way of looking at stock buying that just may correct this disaster.

Bad News Buying
Somewhere along the line the little guy got the idea that because he has money to invest, he has to buy. But for some reason, his buying is always after a runup and never when the market is taking a hit.

The time to buy is when the market presents an opportunity. That means picking up great stocks when they are cheap, not when you have cash. But to make this “bad news buying” approach work you have to stop acting like a rube who just got off a turnip truck and start thinking like a predator.

You must see the market for what it really is… A place where the newbies, the emotional, the undisciplined and the uninformed end up as someone’s dinner. If you try to force opportunities simply because you have some cash and want to buy, I guarantee you will be the entrée on someone’s menu.

Stop drooling over the nightly list of the stocks that ran up the most in that day’s trading session. In 90% of those cases, the money has already been made. Look at the biggest losers and start following them. Study the ones everyone is selling. Understand why they are selling off and look for opportunities there. That’s where the big money is.

And the really good news: You don’t have to go outside your safety envelope to be a “bad news predator.”
In the last year, tons of big-cap companies, many with dividends, have hit temporary rough spots… Coal, gold and copper miners, natural gas drillers, utilities, the list goes on and on.

Despite the big runup in the stock market this year, there are bad news bargains all over the place. Amidst the White House’s war on coal, the incredible low price for natural gas and the world’s sudden aversion to gold… the utility sector is home to some great bargains.

Here’s a perfect example of a great large-cap company with a huge dividend that is one of the best utilities on the market.

A 16% Discount
Southern Company (NYSE: SO) is a rock-solid $38 billion utility company that’s perfect for a retired person’s portfolio. It provides an essential service – electricity – and has demonstrated again and again it is a stockholder-friendly company.

In fact, Southern has increased its dividend 60% in the last six years, has never cut its dividend and is projecting growth of about 5% a year for the next five years. The stock’s current dividend is 5%.

Additionally, it’s selling for about 16% below its 52-week high: $41, down from almost $49. At $41 a share the stock isn’t going anywhere. This is one you could own forever. But maybe one of the best reasons to own it is that no one is looking at it, not yet anyway. Of the 21 analysts who follow the stock, 18 rate it as a “Hold” or “Underperform.”

The White House’s war on coal is responsible for most of the sell-off in this stock. The EPA’s tougher-than-expected new emission standards will cost utilities a lot of money, and it will take some time for Southern to absorb the new costs and get back on track. The herd has been dumping this one, but it is only a temporary setback.

It is possible Southern could drop a little more. But I guarantee if you wait for good news to hit, which it eventually will, and the company moves back to just its previous high, which it will, you will pay too much and the payout will drop to 4%, or less.

The toughest transition for a developing investor is moving from a good news rube to a bad news predator. But this is how you turn other people’s mistakes into your gains.
0 Comments

Trade of the Day

10/17/2013

0 Comments

 
Picture
MARKET CONDITIONS

Avago Technologies Limited (AVGO) is a $11.0 billion technology company that engages in the design, development, and supply of analog semiconductor devices with a focus on III-V based products.

We always seem to focus on what we want to buy and give very little thought to what we should sell. Well, as traders, we should be thinking about selling when risks of holding begin to grow.

While there are many potential sell signals, one of our favorites is when long-term negative divergences begin to emerge. A negative divergence does not guarantee us that the price will decline. What it does, however, is alert us to the fact that the risk of holding is growing.
Picture
Action To Take: AVGO broke out recently to fresh new highs, but the daily MACD is much lower on this move – a sign of slowing upward momentum. Our experience is that many stocks like this will go through a period of selling to perhaps take the stock back to its rising 50 day SMA, effectively “resetting” the daily MACD to or near its centerline support.
0 Comments

From The Street

10/16/2013

0 Comments

 
Picture
MARKET CONDITIONS


Futures on the Dow Jones Industrial Average (INDEXDJX:.DJI) are pointed higher this morning, despite the U.S. being hours away from maxing out its borrowing authority. Investors are cautiously optimistic that congressional leaders will hammer out a resolution to avoid the risk of default. The Senate is slated to resume negotiations at noon. Meanwhile, Fitch Ratings announced last night that it has put the country's 'AAA' credit rating on watch amid the inaction in Washington. Elsewhere, "The 10-year yields closed above the key 2.7% level yesterday," said Schaeffer's Senior Equity Analyst Bryan Sapp. "I'll be watching this closely, as a U.S. default will likely spur a big spike in bond yields."

On the earnings front, Bank of America Corp (NYSE:BAC), Yahoo! Inc. (NASDAQ:YHOO), and PepsiCo, Inc. (NYSE:PEP) are among the notable names that should garner some attention following the release of their respective results.
Picture
Futures on the Dow Jones Industrial Average (INDEXDJX:.DJI) are roughly 62 points above breakeven.

Market Statistics
The Chicago Board Options Exchange (CBOE) saw 1,076,966 call contracts traded on Tuesday, compared to 711,160 put contracts. The resultant single-session put/call ratio rose to 0.66, while the 21-day moving average edged higher to 0.63.
Picture
From the Trading Floor
"Anecdotally, I'm seeing a lot of 'buy the rumor, sell the news' talk about a potential deal," noted Sapp. "The general consensus seems to be that Congress will get something done before tomorrow's deadline, but you should be selling into that. Typically, when everyone agrees on something, it's not right. Should they get something done before the default, I would look for a more prolonged rally than everyone is expecting. Contrarily -- in the (unlikely) event that lawmakers do allow a default -- the markets would most likely get hammered, given the expectations that a resolution will be reached."

Currencies and Commodities
  • The U.S. dollar index is down 0.2% in pre-market trading, with the currency lingering near 80.35.
  • Ahead of tomorrow's debt ceiling deadline, crude oil is flirting with a 0.1% lead, with the front-month contract last seen at $101.29 per barrel.
  • Elsewhere, gold futures are looking to erase Tuesday's modest losses, with gold for December delivery up 0.8% at $1,283.50 an ounce.
Picture
Earnings and Economic Data
Slated for release today is the NAHB/Wells Fargo housing market index and the Federal Reserve's Beige Book. Making an appearance in the earnings confessional are American Express (AXP), International Business Machines (IBM), BAC, eBay (EBAY), PEP, Abbott Laboratories (ABT), Bank of New York Mellon (BK), BlackRock (BLK), Comerica (CMA), Crown Holdings (CCK), KeyCorp (KEY), Kinder Morgan Energy (KMP), Mattel (MAT), MGIC Investment Corp. (MTG), Noble Corporation (NE), Northern Trust (NTRS), PNC Financial Services (PNC), SanDisk (SNDK), Select Comfort (SCSS), Stanley Black & Decker (SWK), Steel Dynamics (STLD), St. Jude Medical (STJ), United Rentals (URI), U.S. Bancorp (USB), Winnebago Industries (WGO), and Xilinx (XLNX).

Overseas Trading
Asian markets turned in another mixed finish on Wednesday. Most eyes stayed focused on U.S. lawmakers, who continue to work toward a budget compromise ahead of tomorrow's debt ceiling deadline. Japan's Nikkei edged higher after a choppy trading day, closing up 0.2% to bring its winning streak to six. South Korea's Kospi dipped 0.3%, and the Hong Kong Hang Seng lost 0.5%. The Shanghai Composite underperformed, dropping 1.8% to a one-week low as investors in the region wait to digest several data points on Friday, including third-quarter gross domestic product (GDP) and retail sales.

European stocks are skewed lower amid negotiations in Washington, D.C., with defensive issues from the telecom and utility sectors outperforming. Across the pond, unemployment in the U.K. held steady at 7.7% in June through August, in line with estimates. The number of people in Britain filing for unemployment, however, dropped by its widest margin since June 1997. At last check, London's FTSE 100 had slipped 0.5%, the French CAC 40 was down 0.8%, and the German DAX was flirting with a 0.1% loss.
Picture
Unusual Put and Call Activity:
Picture
Picture
0 Comments

IT'S A BULL MARKET IN EXPENSIVE FOOD

10/16/2013

0 Comments

 
Picture
Picture
MARKET CONDITIONS


Despite this country's economic situation, luxury spending is on the rise. Tiffany's has expanded their empire with six new stores. Rolls Royce, Lamborghini and Bugatti have two year waiting lists. Can you imagine waiting two years for your now two year old Bugatti Veyron after spending $4.5 million? Tires for that car are $75K each! Although the middle class is shrinking at an alarming rate, there exists two elements; one that is not grossly affected by economic hardships and the other that may be in a state of of denial.

People are spending a lot of money at Whole Foods. And that's more proof "things can't be all that bad" with the U.S. economy. Over the past few years, we've featured dozens of charts that show the U.S. economy is doing better than the pessimists would have you think. For example, Home Depot has skyrocketed because people are spending lots of money on new bathrooms, remodeled kitchens, and backdoor patios.

Another indicator of America feeling flush is the soaring sales and share price of Whole Foods. Whole Foods is America's No. 1 "luxury grocer." Its business is selling expensive food and business is good. Profits have climbed more than 33% in each of the last three years.  

The chart below shows that investors are paying attention to the trend. Shares of Whole Foods are up 1,200% since the beginning of 2009. They just hit an all-time high. We see all this spending on "luxury food" and think things "can't be all that bad" with the U.S. economy.
Picture
0 Comments

The High-Yield Stocks Nobody Is Talking About

10/15/2013

0 Comments

 
Picture
MARKET CONDITIONS


There are quarterly irregulars, which pay a modest dividend in three out of four quarters. One quarterly payment, however, is quite significant. There are also semi-annual irregulars, which pay one large and one small dividend each year.

Most brokerage and investment websites take a stock's most recent dividend payment and multiply it times the payment frequency to get a stock's annual dividend. These websites then use the computed annual dividend to calculate the yield.

For the Wall Street Irregulars, the yield investors see often underestimates the true annual yield of the stock. Below I've listed some irregulars, showing the "posted" yield -- the yield you'll see listed on a financial website -- versus the trailing yield -- the yield based on the company's actual dividend payments over the last 12 months.
Picture
As this table shows, "posted yields" can be deceiving. In fact, these stocks have actually been paying dividend yields that are three or four times higher than what financial websites are reporting.

When I search for a potential holding, I normally look for a security with a predictable and frequent dividend stream. But if you have some flexibility, there are some advantages to owning an "irregular."

Take RLI Corp (NYSE: RLI) for example. RLI is a specialty insurance company with a stellar track record, delivering profits for the past 17 consecutive years and paying a dividend for 148 consecutive quarters. RLI has been paying an irregular dividend payment for the past three years.

The latest irregular dividend was $5.32 per share, up a smidge from the $5.30 it paid the previous year. If RLI maintains both its regular and irregular distributions, shareholders will see a yield of 7.6% at today's prices.

There is no guarantee that RLI will pay as generous an "irregular" dividend as it did last year. But the last three years have set a precedent that I believe management would like to maintain.

Most of the irregulars, like RLI, pay their large dividend near the end of the year. Predictably, investors flock to these stocks when the size of the large dividend is declared, driving up the share price. Investors can get a better price -- and a better yield -- by getting a jump on the crowd. So this is an especially good time of year to shop for irregulars.

More than ever, there are scores of new investors flooding into traditional dividend-paying stocks. Who can blame them, when a savings account is yielding less than 0.5%?

As a result, however, the prices of traditional dividend stocks have risen -- and the yields have fallen. In many cases, these stocks have been priced for perfection and there can be downside risk when these companies deliver less than perfect results. For instance, shares of consumer staples company Procter & Gamble (NYSE: PG) tumbled 6.6% on April 24, after the company projected lower profits than Wall Street expected for the quarter ending June 30.

When traditional income investments get crowded, there is an advantage in looking beyond what everyone else is looking at. For example, the technology sector, which had been all but ignored in this year's market rally.

Now, I'm looking at dividend stocks that aren't normally noticed for their income potential. They represent diverse businesses that pay much higher dividend yields than what's posted on mainstream financial websites. The one thing they have in common is their rising "irregular" dividend payments -- which gives them "hidden" yields of 6.1%, 7.7%, 10% or higher.
0 Comments
<<Previous

    RSS Feed

    Archives

    December 2014
    November 2014
    March 2014
    February 2014
    January 2014
    December 2013
    November 2013
    October 2013
    September 2013
    August 2013
    July 2013
    June 2013
    May 2013

Powered by Create your own unique website with customizable templates.