The Millionaire Maker Investment Advisory
  • Introduction
  • Market Conditions
  • Commodities Corner
  • Featured Interview
  • Understanding Markets
  • Understanding Money
  • Understanding Value
  • The Tax Shelter
  • Retire Rich
  • Radio Blog
  • Contact

The Best Precious-Metals "Mining" Stocks in the World

10/10/2013

1 Comment

 
Picture
COMMODITIES CORNER


Mining is generally a horrible business. You won't hear many resource analysts say that. But I've been saying it for years. Finding, building, and operating a mine – and making a profit – is tough. You can run into strikes, environmental disasters, government interference, and expensive engineering problems.

There's a way to profit off gold and silver mines without taking on all that risk: royalty stocks. And it's time to start buying. Royalty companies don't actually operate mines. Instead, they own a percentage of a mine's production.

Typically, a mining company sells a royalty to raise cash to build the mine. Once the mine is built, the royalty becomes a revenue stream. After the royalty company makes its first payment, the cost of that revenue is practically zero.

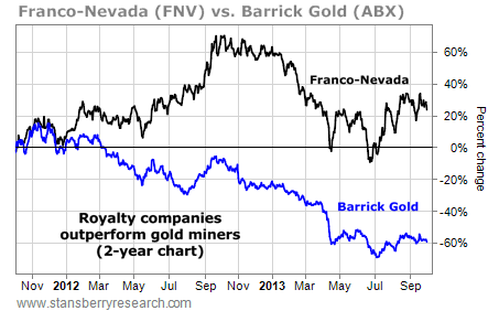
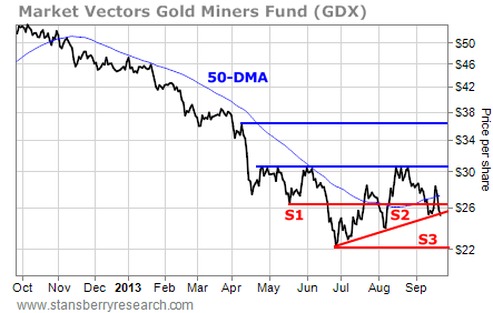
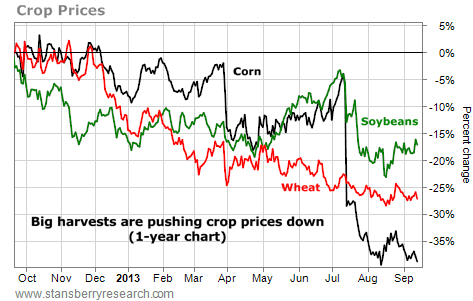
That business model allows royalty companies to generate enormous profit margins of 80% to 90%; a heck of a lot better than the average mining stock. You can see how they weathered the big gold-stock bear market in the chart below.

Franco-Nevada (FNV) is one of the biggest names in the business. It suffered a big drawdown from September 2012 through this summer. But as you can see, it ended the last two years up nearly 30%. Barrick Gold, one of the world's biggest gold producers, is down 60%.
Picture
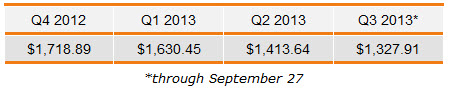
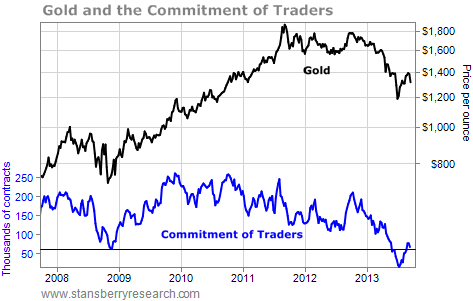
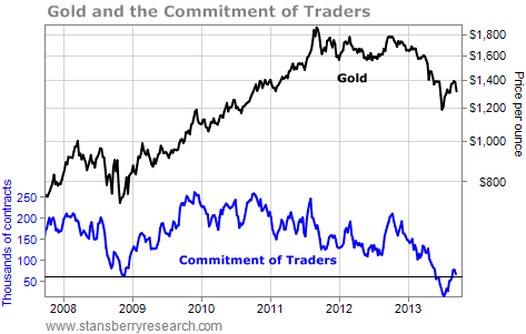
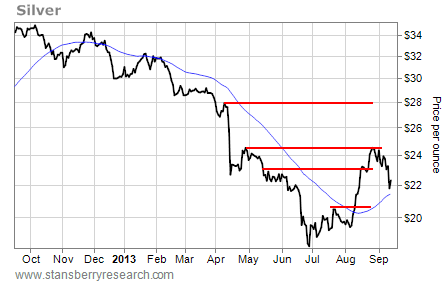
The biggest names in the business are Silver Wheaton (SLW), Franco-Nevada, and Royal Gold (RGLD). Last year, the companies received over $1,600 per ounce of gold and $31 per ounce of silver.

Today, they will get closer to $1,300 per ounce of gold (a 19% decline) and $21 per ounce of silver (a 32% decline). But the stocks are down between 28% and 50% from this time last year. So are they cheap?


I like to use price to EBITDA (earnings before interest, taxes, depreciation, and amortization) to track how cheap or expensive these companies are. The table below shows each company's median price to EBITDA (over the last seven years for Royal Gold and Silver Wheaton and two years for Franco-Nevada) and the current price.
Picture
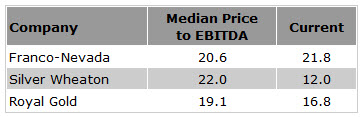
Taking into account the fall in gold prices, Franco-Nevada should have an EBITDA of about $295 million this year. With a market cap of $6.4 billion, its price to EBITDA is 21.8. So Franco is actually on the expensive side. 

Royal Gold is cheaper than average and so is Silver Wheaton. Precious metals haven't been this cheap any time in the last eight years. I expect gains of 50%-100% over the next 12 months, just as it returns to a more normal valuation. If you're looking for a diversified way to profit in a precious-metals rebound, start here.  
1 Comment

Reserves Are in Jeopardy

10/3/2013

1 Comment

 
Picture
COMMODITIES CORNER


By Jeff Clark, Senior Precious Metals Analyst

When you hear about the "gold reserves" a mining company has in the ground, the natural assumption would be that they're talking about a fixed number of ounces. After all, gold doesn't decay, and neither does it grow legs and move someplace else.

But assumptions are dangerous. In fact, industry-wide, reserves are likely to fall fairly significantly in the near future.

When the gold price falls, it doesn't just have a short-term impact on producers—slashed earnings and forced write-downs—it can affect the number of economically mineable ounces a company carries on its books, or even what it can mine in the future.

The Bar Is Higher Reserves are determined by a combination of factors: mostly cutoff grades, metals price assumptions, and projected production costs. For example, based on a gold price of $1,500 per ounce, a project may have economic ore at a cutoff grade of 1 gram per tonne (g/t).

But with gold selling in the low $1,300s, that same deposit may now require a higher cutoff grade, say 1.5 g/t, because the revenue earned from mining ore at the previous cutoff would be lower than the cost to extract it—a strategy that, as we all know, doesn't make a great business plan.

What Was Once "Ore" Is Now Just Dirt Higher cutoff grades reduce the number of economic ounces available for mining, especially if the gold price doesn't recover for a period of time.

Here's the average gold price over the past four quarters:
Picture
As you can see, that's a fairly significant drop, and it has undoubtedly forced many company executives to revisit the price assumptions that were used to determine reserves. That means many reserves requiring a gold price of $1,350/oz or higher are likely to come off the books.

This is the reason high-grade projects have better odds of survival than low-grade ones. Sure, all projects make less money when gold falls, but the higher-grade ones tend to have higher margins and see fewer slowdowns or shutdowns. In many cases, they still make great profits.

High Grading However, there's another phenomenon at work that will conspire to lower reserves: high grading.

Many projects have both low-grade and high-grade zones. When prices fall, a company can mine the richer ore and still make money. It may sound shortsighted, but it can be the right thing to do to stay profitable and be able to survive and advance in a temporarily weak price environment. But it does impact reserves, maybe more than you realize…

When metals prices are low and companies focus on high-grade ore, the low-grade material is temporarily bypassed. It's still physically there, but not only is it not economic at lower metals prices, it may never get mined at all.

That's because some low-grade ore only "works" when it's mixed with high-grade ore. Even when
gold moves back up to the price that the low-grade ore needed to be economic when mixed with the higher-grade ore, it doesn't matter, because the high-grade ore is gone. So it's not just gone legally, as
per regulatory definitions of mining reserves, it may be economically gone for good.

Miners could return to some of these zones in a very high gold price environment (something north of $2,000), but that's a concern for another day. The point for now is that many of today's low-grade zones can no longer be counted as reserves.

Now You See Them, Now You Don't Most companies update their reserves at year-end and report revisions in the first quarter. If gold doesn't stage a strong rebound soon, the industry will see a significant reduction in mineable reserves.

This will have repercussions on the precious metals sector, and on us as investors. As you might suspect, some of it is negative, but it also points to an investment opportunity that we believe will make us a lot of money.

Here's what Major Tom radios in about lower reserves and what that means to us investors…

  • A corresponding decrease in the value of the company. A company with less product to sell won't be priced as high as it was previously. The exception here will be the producers that can maintain strong cash flow; those that do will be the ones that hold up the best.
  • Watch out for companies that take a big write-down in reserves. Many producers will be forced to report lower reserves in early 2014 if gold prices stay where they are. But the Big Red Flags will be those with unusually large drops, because they may not have the reserves to keep production at the same level. These will mainly be the companies with low-margin projects, or those with low-grade material that will remain uneconomic because of high grading. If production falls, the stock will woo fewer investors.
  • Lower reserves = lower supply = higher gold prices. Worldwide gold production is basically flat. If we see a substantial decrease in the number of ounces coming to market as a result of the fallout from reserve write-downs and demand stays at least where it is, prices will be forced up. This is already happening, but if it picks up steam, we could see a fire lit under gold prices.
  • The better junior exploration companies could be big winners. Many producers, out of necessity, have reduced or even cut exploration budgets. Yet if they're going to survive, sooner or later they'll have to find more ounces. Every day a miner operates, his business gets smaller—but if he hasn't been exploring, the ounces won't be there when he needs them.
Enter the junior exploration company with a big, high-grade deposit. These companies will become juicy takeover targets, especially if their projects have strong economics at lower gold prices. Once management teams realize they're running low on ore, there will be a mad scramble for this type of asset.

Even when gold prices return to prior highs, it will take years for large companies that have cut expenses to bring back all the laid-off geologists, identify and drill new deposits, and develop those that are economic.

There will only be one solution, and it will be a pressing one: buy an asset.

That's why right now is the best time to buy those juniors that have robust projects with strong economics. And I just bought one…

Casey Chief Metals Strategist Louis James recommended an advanced-stage gold exploration play in the current issue of the Casey International Speculator. The company has a large, high-grade deposit in Europe that looks poised to become much larger.

I plan to buy the best undervalued juniors now and be patient until the producers come a-calling. A monstrous run-up is coming in the junior sector, and all you have to do to profit is wait for the inevitable to arrive. Reserves are going lower, yes, but we'll be making some money.

1 Comment

September 25th, 2013

9/25/2013

0 Comments

 
Picture
COMMODITIES CORNER


It's last week all over again. The gold sector was at an important decision point last week. The Market Vectors Gold Miners Fund (GDX) was sitting right on support. A bounce higher would likely kick off the start of a new intermediate-term rally for the gold sector. A break below support would cause a retest of the June lows. 

One way or another, gold stocks were set up for a big move. And the Federal Open Market Committee (FOMC) meeting was the catalyst. GDX exploded higher last Wednesday after the Fed announced it would continue its quantitative easing program. The decision to keep throwing $85 billion worth of freshly printed bills into the financial markets every month was enough to boost the gold sector by 9%. GDX bounced solidly off support. It closed back above its 50-day moving average (DMA) and the pattern remained consistent with the action we saw as gold stocks bottomed in 2008.  

All the sector had to do to confirm its new uptrend was to avoid giving back too large a chunk of those gains over the next few days. We could then pile into the gold sector aggressively, with complete confidence that the intermediate-term rally we've been looking for over the past few weeks was finally underway.  

But gold stocks never make it that easy. By the close of trading on Monday, GDX had given back all of last Wednesday's gains and then some. So we're back to the same conditions we had just before the FOMC announcement last week. GDX is sitting on an important support level. It either bounces from here, rallies back above the 50-DMA, and kicks off a strong rally similar to what happened in late 2008 or it breaks below the recent low around $25 and heads back down to retest the June low at about $22. Here's the updated chart.
Picture
It's decision time for gold stocks. GDX either holds support right here and bounces, or it fails. Either way, the move is going to happen within the next few days.
0 Comments

A Low-Risk, High-Reward Gold Trade Right Now

9/24/2013

0 Comments

 
Picture
COMMODITIES CORNER

Gold is more hated right now than it’s been in years… and I love it. We have the perfect setup for a great trade in gold. Your upside is 70%-plus in the next year. Your downside risk is just 9%. A risk-versus-reward setup just doesn’t get much better than that!

The last time gold was even close to this hated was back in 2008 and it soared 71% in the following 13 months. This time around, it could go even higher. You see, gold is even MORE hated than it was in 2008. The clearest measure of how hated gold has gotten is what real traders are doing with real money; and the real money has bailed on gold.

A couple of months ago, the Commitment of Traders report showed that “large speculators” – hedge funds,

were more bearish on gold than they have been in years. Take a look at the chart below. You can see how these large speculators bailed out:
Picture
Large speculators became extremely bearish on gold a few months ago. But in late June, the position started to reverse, around the same time gold bottomed. Gold bottomed at less than $1,200 per ounce. Today, gold is up but not dramatically – at around $1,300 per ounce. This could be the start of a new uptrend.

So gold is HATED. And it has a bit of an UPTREND in place. These are two of the three things I look for in an investment. (The third thing I look for in an investment is “cheap.” But it’s almost impossible to put a fair value on the price of gold.) This is about as good as it gets for placing a trade in gold.

We have incredible upside potential here… Remember, gold soared 71% in 13 months the last time we saw a similar setup. And gold is even more hated today than it was back then. Here’s what you should consider doing...

I suggest putting on a 12-month trade in gold, right now. Buy today, and sell next September. You could pocket 70% or more. To protect your downside risk, set a stop loss at gold’s June low.

The easy way to make this trade is through SPDR Gold Shares (GLD), the big gold fund. GLD’s June low was around $116. So if shares of GLD close below $116 any time in the next 12 months, sell the next day for about a 9% loss. On the flip side, a 70% gain in gold would put shares of GLD well above $200. Those are great trading odds.

There is an excellent setup for a low-risk, high-potential-upside trade in gold right now. Don’t miss it.
0 Comments

A MAJOR DOWNTREND IN FOOD PRICES

9/17/2013

1 Comment

 
Picture
COMMODITIES CORNER


Good news for anyone worried about grocery bills: U.S. farmers are sitting on a bumper crop this year. In recent months, we've noted that contrary to what most folks believe, commodity prices are in a long sideways market.

There's a good reason for this. When commodity prices rise, companies respond by ramping up production.  The latest example is three major U.S. crops: corn, wheat, and soybeans. Prices for these commodities jumped in 2012 after a major drought hit the Midwest. But this year, the farm belt is expecting a record corn crop.

Good weather is also boosting the outlook for this year's wheat and soybean harvests. As you can see in today's chart, the result is a big downtrend in the price of these crops. Corn prices are down nearly 40% over the past year. Wheat and soybean prices are both down more than 15% in the same time frame.

Prices for each of these crops are back around the same levels as five years ago. U.S. farmers are helping keep food prices down and that's good news for everyone.
1 Comment

A Low-Risk, High-Reward Gold Trade Right Now

9/17/2013

0 Comments

 
Picture
COMMODITIES CORNER


Gold is more hated right now than it's been in years... and I love it. We have the perfect setup for a great trade in gold. Your upside is 70%-plus in the next year. Your downside risk is just 9%. A risk-versus-reward setup just doesn't get much better than that! Let me explain.

The last time gold was even close to this hated was back in 2008 and it soared 71% in the following 13 months. This time around, it could go even higher. You see, gold is even MORE hated than it was in 2008.   The clearest measure of how hated gold has gotten is what real traders are doing with real money and the real money has bailed on gold.  

A couple of months ago, the Commitment of Traders report showed that "large speculators" – hedge funds – were more bearish on gold than they have been in years. Take a look at the chart below. You can see how these large speculators bailed out:
Picture
Large speculators became extremely bearish on gold a few months ago but in late June, the position started to reverse, around the same time gold bottomed. Gold bottomed at less than $1,200 per ounce.

Today, gold is up... but not dramatically – at around $1,300 per ounce. This could be the start of a new uptrend. So gold is HATED and it has a bit of an UPTREND in place. These are two of the three things I look for in an investment (The third thing I look for in an investment is "cheap." But it's almost impossible to put a fair value on the price of gold.).  

This is about as good as it gets for placing a trade in gold. We have incredible upside potential here. Remember, gold soared 71% in 13 months the last time we saw a similar setup. And gold is even more hated today than it was back then. Here's what you should consider doing...

I suggest putting on a 12-month trade in gold, right now. Buy today, and sell next September. You could pocket 70% or more. To protect your downside risk, set a stop loss at gold's June low.  

The easy way to make this trade is through SPDR Gold Shares (GLD), the big gold fund. GLD's June low was around $116. So if shares of GLD close below $116 any time in the next 12 months, sell the next day for about a 9% loss. On the flip side, a 70% gain in gold would put shares of GLD well above $200.  

Those are great trading odds. We have an excellent setup for a low-risk, high-potential-upside trade in gold right now. Don't miss it.
0 Comments

Don't Miss This Chance to Buy Silver

9/17/2013

0 Comments

 
Picture
COMMODITIES CORNER


By Jeff Clark
 
The financial markets are sometimes generous with second chances. But they're stingy with thirds.  So traders looking to get in the silver trade should take advantage of last week's pullback and use it as a second chance to buy the metal.  


When we last looked at silver in August, the price had just broken above its 50-day moving average (DMA). That signaled a change in trend from bearish to bullish.  And it kicked off an intermediate-term rally in the price of the metal.  But the price had moved up too fast. Silver was overextended and bumping into resistance.  It was due for a quick drop lower to retest its 50-DMA from above.  Here's what we advise
you to do.  

If you're not in the silver trade yet, give the metal a chance to pull back and work off its current overbought condition.  Then start buying on any move near $21 per ounce.  Traders got the chance to buy Friday morning.  But if you slept in, you missed it.  Silver traded as low as $21.42 per ounce in early morning trading.  But by the end of the day, the selling dried up. Buyers stepped in and the metal ended the day at $22.28 per ounce.  

Anyone prepared to buy as the metal came down and tested its support line was sitting on a 4% profit by the end of the day. Take a look at this chart...
Picture
The chart now shows a series of higher lows.  The 50-DMA (the blue line) has turned higher and was tested as support on Friday. It held. So now silver should be headed higher, and the price should work its way toward the $28 resistance target we pointed out last month. 

Traders who missed last Friday's "second chance" to get into the silver trade now have a choice to make. They can jump in and buy silver right now – just a little above the 50-DMA.  Or they can cross their fingers and hope for a third chance to buy.  But like I said earlier... the market is stingy with third chances.
0 Comments

JP Morgan's Gold Manipulation

9/17/2013

0 Comments

 
Picture
COMMODITIES CORNER

I was picking my way through some commentary that Miles Franklin dropped into my in-box yesterday, and I found this wonderful quote that he ripped from Ted Butler's column on Saturday, and since it's now in the public domain, here it is!

I know that some have questioned how it could be possible for gold to decline so much in price if JPMorgan held a long market corner. The answer is clear, once you remember that prices only fall sharply in order to enable JPMorgan to buy. Near the bottom in gold prices at $1,200, JPMorgan was long 85,000 contracts.

On the subsequent $250 rally, JPM sold off and closed out nearly 30,000 contracts of their long gold market corner, booking and realizing $350 million in profits. Now JPMorgan has decided to buy more and has cratered gold prices by more than $100 in order to re-buy as many new gold contracts as they can.

JPMorgan is not concerned that the market may have temporarily gone against their existing gold corner as they continue to buy as many contracts as possible. JPM wouldn't have any problem in meeting margin calls as it is presently structured; because it rests upon unlimited funding. When you look back at this year, it is crystal clear that JPMorgan made $3 billion in buying back big short positions in gold and silver and actually flipping their short corner in COMEX gold to a long corner that they've already milked for a $350 million profit recently, and so far. - Ted Butler, September 14, 2013.

I also got a charge out of something that Barry Ritholtz wrote on Sunday afternoon about the fact that Larry Summers had withdrawn his name as a candidate for Fed Chairman, and I thought it was right on the money.  I thank readers "Jim and Elena" for sending it our way.

"Here’s what President Barack Obama‘s statement on Lawrence Summers‘s decision to withdraw his name from consideration to be the next chairman of the Federal Reserve would have looked like after 40 milligrams of Sodium thiopental":

“Earlier today, I spoke with Larry Summers and accepted his decision to withdraw his name from consideration for Chairman of the Federal Reserve.

Larry was a critical contributor to the radical deregulation that was one of many causes of the worst economic crisis since the Great Depression. It was in no small part because of his lack of expertise, false wisdom, and inept leadership that the economy crashed and burned and even today is still failing to be to back to its full growth potential.

As Treasury Secretary, he helped to pass the Commodity Futures Modernization Act. This turned derivatives into a unique financial instrument with no oversight, reserve requirements, mandated disclosures, or listing minimums. The CFMA all but guaranteed that Derivatives would eventually implode. Summers further contributed to the crisis by Summers by overseeing the repeal of Glass Steagall. With this firebreak between Wall Street and Main Street effectively removed, the financial conflagration of 2008 spread from Wall Street to every corner of the economy.

Further, his terrible advice and lack of insight is in large part the reason we see so little progress being made today — the lack of economic growth, the concentrated bank power, the still dangerous financial system and of course, the sub-par job creation.

I will always blame Larry for the way he damaged my presidency. To anyone who may seek his guidance and counsel in the future, please don’t make the same naïve errors I did.
0 Comments

Yesterday in Gold and Silver

9/12/2013

0 Comments

 
Picture
COMMODITIES CORNER


Except for a little price excitement between 9 a.m. and noon in Hong Kong yesterday, it was pretty much a nothing sort of day for gold.  The low of the day came just after 12 o'clock noon in London, and the tiny rally going into the Comex open wasn't allowed to get far.

The gold price closed at $1,365.80 spot, up $2.50 from Tuesday's close.  Net volume was extremely light, about 104,000 contracts.
Picture
You can be forgiven if you mistake the silver chart for the gold chart, or vice versa; as they look identical.  And, like gold, the tiny rally that began at the noon silver fix in London, didn't get too far once trading began in New York.

Silver finished the Wednesday session at $23.215 spot, up 24.5 cents from Tuesday.  Net volume was a very quiet 34,500 contracts.
Picture
Both platinum and palladium made rally attempts in Far East trading on their Wednesday morning, and neither got far.  Platinum then got sold down the moment that Zurich opened, and that continued until late in the Comex trading session in New York.  Palladium ran into a price ceiling at the $700 spot price mark, before getting sold down when trading began on the Comex.  Here are the charts.
Picture
Picture
The dollar index closed on Tuesday afternoon in New York at 81.83.  When it opened in Far East trading on their Wednesday morning, it rallied up to 81.93 by 2 p.m. local time in Hong Kong, then it was all down hill until the 81.46 low at 1:30 p.m. in New York.  After that, the index didn't do much, closing the Wednesday session at 81.53, which was down 30 basis points from Tuesday's close.
Picture
The gold stocks more or less followed the gold price.  They opened up about one percent, but immediately got sold down two percent, with every rally attempt after that also meeting with an eager seller.  However, the upward bias remained intact into the close, and the HUI finished up 0.67%.
Picture
The silver stocks followed a virtually identical chart pattern as gold, and Nick Laird's Intraday Silver Sentiment Index closed up 0.71%.
Picture
The CME's Daily Delivery Report showed that 13 gold and 7 silver contracts were posted for delivery on Friday within the Comex-approved depositories.  There were no reported changes in GLD, and as of 9:22 p.m. EDT there were no updates posted for SLV.

The good folks over at the shortsqueeze.com Internet site updated the short positions for both GLD and SLV as of 31 August.  SLV showed an increase in its short position of 18.94 percent, which translates into an additional 2.53 million shares which were sold short because there was no metal available to deposit when the original transaction[s] was/were done, so the authorized participant was forced to short the shares in lieu of the real deal.  I would bet a fair chunk of change that the deposit into SLV that was reported on Tuesday, 964,058 troy ounces, was made by an authorized participant [read JPMorgan Chase] to cover part of that short position.

The 15,880,700 troy ounces/shares currently sold short [in total] in SLV as of this report, represents 4.5 percent of the outstanding shares of SLV, or around 500 metric tonnes.  Using past as prologue, this is not an outrageous amount.  But the fact of the matter is that there should be zero short position in any hard metal ETF.  Can you imagine the hue and cry if CEF or PSLV did an offering, got the cash, and then didn't buy/deposit all the metal they said they would?  Shareholders would burn Eric Sprott and Stephan Spicer at the stake; after they got out of jail for fraud, that is.  But nobody bats an eyelash when this happens in SLV or GLD.  [Now you know why I wouldn't touch either of these ETFs with the proverbial 10-foot cattle prod.]

There was only a tiny increase in the short position over at GLD.  This new report showed 2.68 percent.  But the total number of GLD shares sold short is about 10 percent of all the outstanding shares issued in GLD, over 3 million troy ounces of gold in total, almost 100 metric tonnes.  This is an outrageous amount.  Why the GLD fund managers allow this situation to exist is beyond me.

Before laying this issues aside, dear reader, let me ask this question.  What would the silver and gold prices be by the end of the trading day today if the authorized participants had to go out and purchase real metal in the open market to cover their portion of the outstanding short positions in both these ETFs, especially silver?  And you wonder why Ted Butler is screaming about the permanent short positions in both GLD and SLV.  It's out and out fraud. There were no reported sales from the U.S. Mint yesterday.

Over at the Comex-approved depositories on Tuesday, they reported almost no activity in gold.  None was reported received, and only 482 troy ounces were shipped out.  It was pretty quiet in silver as well on Tuesday.  Only 116,244 troy ounces were received, and 40,237 troy ounces were shipped out the door for parts unknown. 
0 Comments

New Price Target For Oil

8/29/2013

0 Comments

 
Picture
COMMODITIES CORNER

A lot of so called experts had actually told me that oil wasn't going anywhere and would be stagnant for the next quarter or so. The more those fools talked the more I  increased my exposures on my MLP and PSX positions and boy how it has paid off. Are people that naive? These fossil fuel companies are in
it to win it all. I am banking on their greed until 2018. I believe that will be the time when we will see new energy technologies really start to emerge and take real form. By the way, these technologies have already been developed
or acquired by the same fossil fuel energy giants and are collecting dust on a shelf somewhere probably in Texas.

Troublemakers in Egypt and Syria – and some saber-rattling American politicians – helped send oil to a new high this week.  

The price of oil has broken out to the upside of the "double top" pattern I showed you a few weeks ago. So instead of a quick profit off an oil breakdown, anyone who shorted shares of the United States Oil Fund (USO) should have stopped out of the trade for a tiny loss.  

Now with a new set of circumstances – and a new chart pattern – it's time to take another look at oil and see what the next trade setup might look like.  

Here's a chart of West Texas Intermediate (WTI) crude, the benchmark U.S. oil price...  
Picture
As you can see in the chart above, the difference between oil's recent support and resistance levels is about five points. So if we add five points to the breakout level of $108, we get a target price for oil of $113.  That target price lines up well with the resistance of oil's former high price in 2011. Take a look at this longer-term chart below.
Picture
But there are still several reasons to be bearish on oil. Oil inventories are higher than average for this time of year and it has a seasonal tendency to decline in September. Also, demand for oil has been declining due to sluggish economic growth.  

The big reason to be bullish right now is the impending U.S. military action in Syria. That possibility trumps the supply/demand concerns. It has pushed oil to its highest price in two years. And it'll likely push prices a bit higher.   But as the price of oil approaches the $113 target level and the threat of military action runs its course, oil is likely to form an important intermediate-term top.  

That will be the time for traders to take another shot at a short sale in the oil market. 
0 Comments
<<Previous
Forward>>

    RSS Feed

    Archives

    December 2014
    February 2014
    November 2013
    October 2013
    September 2013
    August 2013
    July 2013
    June 2013
    May 2013

Powered by Create your own unique website with customizable templates.