The Millionaire Maker Investment Advisory
  • Introduction
  • Market Conditions
  • Commodities Corner
  • Featured Interview
  • Understanding Markets
  • Understanding Money
  • Understanding Value
  • The Tax Shelter
  • Retire Rich
  • Radio Blog
  • Contact

3 Ways to Profit From Cheap Oil Stocks

12/9/2014

0 Comments

 
Picture

Oversold readings are
beginning to flash loud
and clear

By Serge Berger


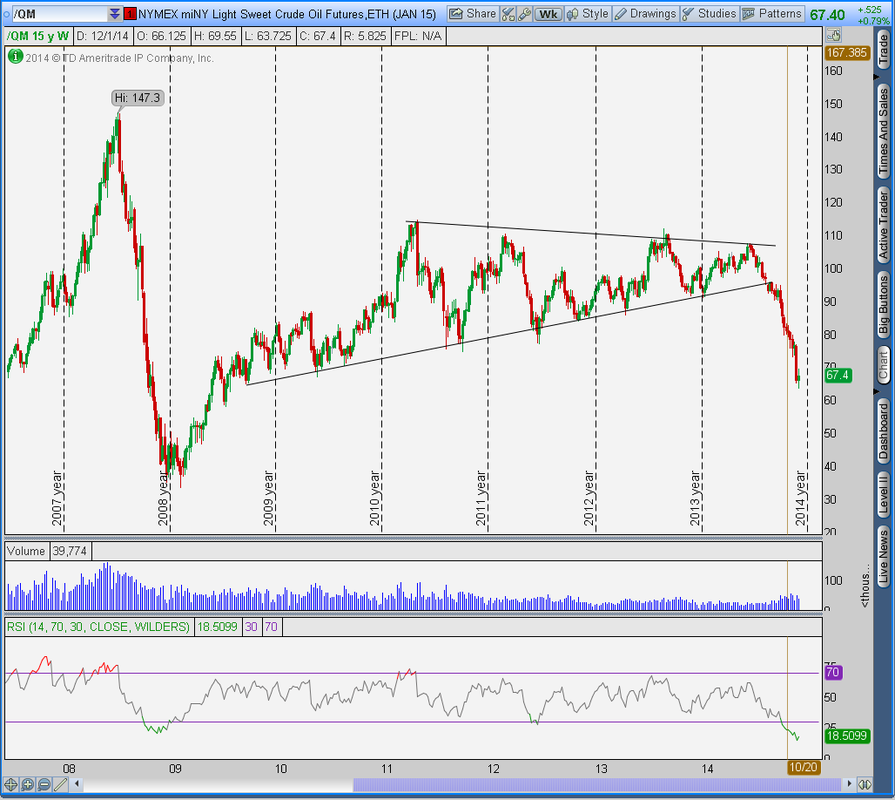
We all know it, it’s all over the news: the price of oil is dropping precipitously. Of course as these things go by the time the headlines are over it, it usually is time to take the opposite side of the trade, at least from a near- to medium-term perspective.

Lower oil prices, however, can have wide-ranging consequences, from a discount to the consumer to economic hardship and even social unrest in major oil-producing emerging markets.

We don’t have to look far for evidence that — as Mark Twain is credited for saying, “history does not  repeat itself, but it rhymes” — as we consider the economic challenges that Russia faces as of late, worsened by the dramatic fall in oil prices and a collapsing currency.

When it comes to profiting in the markets, investors and traders alike must be able to distinguish between different time frames and what the fundamental, structural and technical pictures are saying.

For a few weeks to possibly a couple of months, the price of oil increasingly looks to be oversold and ripe for a better bounce. This in turn could also lead to a bounce in oil-related stocks as the correlation between oil and stocks is high.

Click to Enlarge
Picture
Cheap Oil Stocks: Diamond Offshore Drilling Inc (DO)

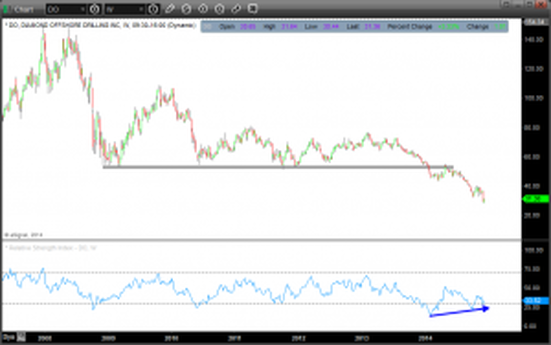
Shares of deep water oil drilling company Diamond Offshore Drilling Inc (DO) have been declining since topping out in 2008, so the continued sell-off in 2014 is nothing new. The price action in early 2014, however, broke the stock below a support line that stretches back to early 2009.

Unlike what traditional technical analysis would have one believe, such big picture support breaks in the aggregate lead to better bottoming phases rather than new multi-year down moves.

Case in point, the multi-year chart shows that momentum as represented by the Relative Strength Index (RSI) bottomed in January as DO stock broke below support but has since formed a series of higher lows, thus giving us positive divergence between momentum and price and indicating that a better bottoming process may be developing.

Tactically, once DO stock can wiggle itself back above the $32 area it stands a better chance of strutting higher toward the $35-$36 area into year-end. When it does that, it is an oil stock to buy.

Click to Enlarge
Picture
Cheap Oil Stocks: Transocean LTD (RIG)

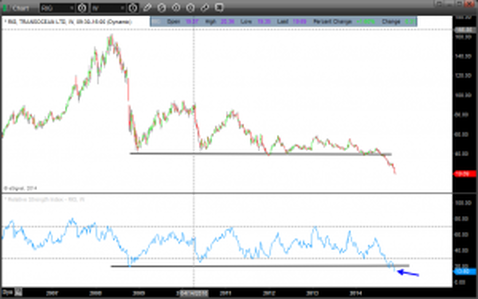
Shares of oil drilling company Transocean LTD (RIG) have taken a similar fate to that of Diamond Offshore Drilling — since topping out in 2008 it has only trended lower.

To put the multi-year drop in perspective, note that since the 2008 drop RIG stock has fallen about 88% and now sits at levels not seen since 2004.

Looking at the Relative Strength Index (RSI) at the bottom of the chart, note that while we are not seeing any positive divergence between momentum and price as we do in DO stock, the RSI indicator with a reading below 13 is now the most oversold it has ever been.

This likely argues for a mean reversion bounce in the near future. Here too however, RIG does need to first show us that it can stabilize before a good entry for a bounce makes sense.

Given the steep drop and historically deep oversold readings it likely is only a matter of time until such a bounce occurs, which once the stock can overcome the $21 area could quickly lead to a move back toward the $23-$24 area, making it an oil stock to buy.

Click to Enlarge
Picture
Cheap Oil Stocks: Market Vectors Oil Services ETF (OIH)

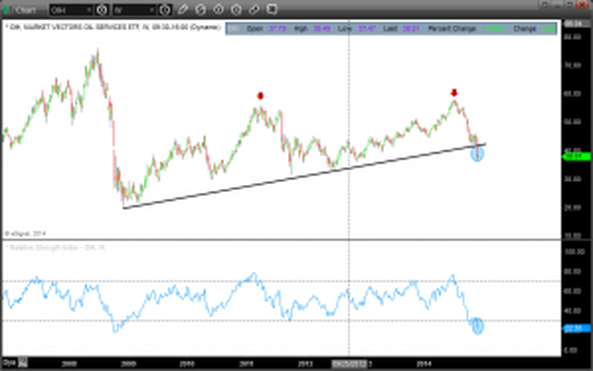
Shares of the Market Vectors Oil Services ETF (OIH), a diversified oil services fund, given the carnage in the price of oil and oil services stocks of late has also taken a beating since topping out in July.

The OIH has dropped more than 35% since the July top, which also resulted in the ETF snapping its late 2008 support line and in oversold readings in the RSI not seen since then.

Investors and traders looking to consider playing an oversold bounce in oil via the oil services stocks, instead of stock picking may just want to look at this ETF. Important to keep in mind is that with the recent spike in volatility in oil related stocks, correlation among those stocks has risen as well.

This is to say that any oversold bounce is likely to lift the entire group of stocks and buying an ETF could just simplify the trade. For the OIH, a move back above $39 could send this stock back into the low $40s into year-end, which would also serve as a good re-test of the aforementioned broken longer-term support line.

Click to Enlarge
Picture
0 Comments

5 Energy Stocks to Buy at 5 Different Oil Prices

12/8/2014

1 Comment

 
Picture
Worried about falling oil prices?

We break down where different energy companies are profitable.


By Aaron Levitt

In case you’ve been leaving under a rock, energy prices have cratered over the last few weeks.

Source: iStockphoto.com The combination of rising production, lower demand and a lack of negative geo-political events has pushed Brent crude oil prices below $70 per barrel.

That’s the first time prices have been that low since 2010. More pain is expected as oil cartel OPEC has pledged not to cut production in the near future. This is great news for drivers who don’t have to pay a ton to fill up their gas tanks. It’s not so great for investors in energy stocks.

Shares of energy stocks have plunged equally hard as crude oil. The reason is that some forms of energy extraction aren’t profitable at current levels, which throws investors in the sector for a serious loop. However, some research from Morgan Stanley and U.S. Global Investors highlights the average break-even point for many forms of oil production — from U.S. shale to offshore African fields.

But not all energy stocks are hit equally hard by falling oil prices. Most companies are profitable at different prices, so investors just need to know which energy stocks are profitable at which oil prices.

Here are five energy stocks and where they need prices to be in order to turn some profits.

Picture
Goodrich Petroleum Corp. (GDP)
Profitable at: $80 per barrel

Located in between Louisiana and Mississippi, the Tuscaloosa Marine Shale has been called one of the last great opportunities in North American shale for energy stocks. According to early estimates, the field holds at least 7 billion barrels of oil. And while that potential has been known for years, the technology to reach it has finally caught up to snuff.
 Unfortunately for Goodrich Petroleum Corp. (GDP) that technology is expensive. Very expensive.

GDP needs oil to be at roughly $80 per barrel to justify the cost of fracking its substantial acreage in the region. And with oil currently in the $65 to $70 range, GDP is losing money with every well it drills. So it’s no wonder why GDP stock has fallen nearly 80% in the past three months.

The silver lining for investors in GDP stock is that it’s pretty much the only firm drilling in the Tuscaloosa Marine Shale. Those 7 billion barrels of oil are nothing to sneeze at, and we’ll eventually will need to tap that fuel. That means GDP will either get bought out at a premium to its current share price or rebound sharply as energy prices rise. That rebound could make its sub-$5 price tag an interesting deal for wildcatting investors.

Picture
Suncor Energy Inc. (SU)
Profitable at: $70 per barrel

Forget the problems with the Keystone XL pipeline. Canada’s oil sands industry needs
high oil prices for it survive and make a serious profit. According to the investment banks research, that’s around $70 per barrel — roughly where we are today.
Suncor Energy Inc. (SU), one of the largest energy stocks in the oil sands, has fallen about 26% from its peaks since oil has slid.

SU first pioneered oils sands extraction back in the 1960s and features some of the largest acreage positions in the region. Currently, Suncor produces around 403,000 barrels per day from its holdings. And as the leader in the oil sands production, SU has also plowed much of its energy into cost controls and efficiency measures — such as automated mining of bitumen — to improve its profit margins.

But Suncor isn’t a one-trick pony. It has a vast energy empire comprised of up- mid- and downstream operations to boost its cash flows and earnings in lean times. SU stock boasts a forward P/E of less than 10 and a 3.1% dividend yield, so investors are getting a real bargain compared to most energy stocks.

If oil prices rise, SU stock investors should be in even better position.

Picture


Energy Stocks to Buy — Energy XXI Ltd. (EXXI) Profitable at: $60 per barrel

The shallow waters of the Gulf of Mexico have all been abandoned by larger energy stocks. That leaves opportunities for more smaller & nimble players- such as Energy XXI Ltd. (EXXI).
 Analysts estimate that traditional shallow-water drilling in the Gulf requires oil at around $41 per barrel to be profitable. The rub for EXXI is that it uses a combination of new seismic and horizontal drilling/fracking technology to find pockets of oil left behind by larger firms. That kind of energy production requires oil at roughly $60 per barrel for it to be profitable.

Two big shallow water acquisitions by EXXI — a $2.3 billion deal for EPL Oil & Gas as well as buying $1 billion worth of Exxon Mobil’s (XOM) assets — have helped boost Energy XXI’s reserves in the region by more than 50% in 2013 alone.

Unfortunately, those acquisitions also helped balloon the firm’s debt load. Hence the 87% year-to-date drop in its stock price.

Like previously mentioned GDP, EXXI isn’t for the faint of heart. But if oil continues hover around this mark — and even if it drops a tad further — EXXI should be OK. Its gross profit margin is at currently at 63%, which leaves EXXI stock some room for faltering oil prices.

Picture

Energy Stocks To Buy — Baytex Energy Corp. (BTE) Profitable at: $50 per barrel

Baytex Energy Corp. (BTE) isn’t a household name, but the firm owns some large holdings along the Alberta and Saskatchewan borders. About 86% of its reserves and production come from oil and natural gas liquids (NGLs). The bulk of that is conventionally produced heavy oil.
Heavy oil and oil sands crude are often confused. While both feature high gravity and are “goopy,” their production methods are very different. Namely, you can get heavy oil out of the ground using some regular conventional production methods — with a few slight modifications. When we talk about crude imports from Canada, this is the stuff that is most shipped downward into the U.S., not tar sands crude.

According to analysts, the cost of production for heavy oil is currently around $50 per barrel. As such BTE has managed to carve out a decent living.

However, the recent rout in energy stocks has caused shares to plummet, leaving investors with a hefty 12.9% dividend yield. As long has oil doesn’t plunge significantly further, that dividend yield should be safe.

Picture


Energy Stocks to Buy — EOG Resources, Inc. (EOG) Profitable at: $40 per barrel

The real winners could be investors who take the plunge and buy North American shale producers with huge scales of efficiency. Case in point: EOG Resources, Inc. (EOG).
EOG is one of the nation’s fracking kingpins and has become one of the go-to names in the prolific Eagle Ford. The company has enviable acreage in the region and uses that to its advantage. For the latest reported quarter, EOG produced the equivalent of 614,100 barrels of oil per day — a 17% jump from last year’s 526,400 barrels per day.

An aggressive drilling program and a mini-integrated model have been driving that surge in production. EOG owns other pieces of the energy stock’s value chain, including frac-sand mines and crude-by-rail terminals. All in all, that integration drives a huge rate of return for the producer. At $80 per barrel, EOG has a nearly 100% rate of return.

The beauty is, if oil drops all the way down to $40 per barrel, EOG will still see a 10% rate of return on its wells. That makes it one of the only producers in North America’s shale that will see a profit if oil prices get that low.
1 Comment

Tag-Along Visit With Mining Billionaire Robert Friedland

2/20/2014

2 Comments

 
Picture
Billionaire Robert Friedland
COMMODITIES CORNER

A Tag-along Visit with Mining Billionaire Robert Friedland comes from Tommy Humphreys at CEO.CA. He had the exclusive opportunity to report on reclusive and media-wary billionaire Robert Friedland’s recent trip around some of
South Africa’s biggest potential mines.

Robert Friedland is one of the most prominent players in the mining sector today. The following piece should provide some insight into the mining mogul who once mentored Apple founder Steve Jobs.

By Tommy Humphreys, CEO.CA

Excerpted and edited from On an African dog and pony show with mining mogul Robert Friedland,
published February 17, 2014.

Picture
Ivanhoe Mines executive chairman Robert Friedland at the site of the initial Kamoa copper discovery in the Katanga province, D.R. Congo – Feb 11, 2014. Photo: Govind Friedland
Robert Friedland became a multi-billionaire over the past 35 years by finding and developing mining ventures on nearly every corner of the globe.

I was on a trip with Friedland last week and toured three of his latest mining projects in South Africa and the Democratic Republic of Congo (DRC). After two years of asking, he had let me tag along.

Robert Friedland is actually credited with having taught Steve Jobs about the ‘reality distortion field’ when Jobs was in college in 1972.

The ‘reality distortion field’ is a personal intensity and vision so powerful it bends people to your will, convincing them of a project’s higher purpose. Steve Jobs, as founder and CEO of Apple, managed to sell mountainous innovation, redefining the relationship between art and technology, partly because he developed this personality trait early on.

Friedland’s company spent nearly 20 years looking for platinum before finding arguably one of the best platinum ore bodies in the world: the Platreef deposit.

Picture
Ivanhoe Mines CEO Lars-Eric Johannson (middle), Executive Chairman Robert Friedland (right). Near Platreef, Limpopo, South Africa. Photo: Tommy Humphreys
Ivanhoe Mines CEO Lars-Eric Johannson (middle), Executive Chairman Robert Friedland (right). Near Platreef, Limpopo, South Africa. Photo: Tommy Humphreys, CEO.CA

A Japanese consortium gave Ivanhoe Mines $290 million for 10% of Platreef in 2010 and 2011. The Platreef, once built, would be unlike all other platinum mines in South Africa.

Platinum production is a mess in South Africa. 73% of the world’s platinum originates there, but the average mine is a kilometer deep, where underground workers mine ore bodies just a meter thick, in blazing hot temperatures upwards of 122ºF (50ºC).

Conversely, the Platreef ore body is purported to be 24 meters thick on average which allows for air-conditioned, mechanized labor. In fact, Friedland bets that most of the project’s underground workforce will be women; they are proven to be better at operating large mining machinery, he says.

Picture
This valley shows the Platreef project site. 800 meters below lies the flat, thick PGM orebody.
We also flew to Lubumbashi in the DRC’s Katanga province (a.k.a. the land of copper). Katanga is lush green country with reddish brown soil. Shacks, French signage, and smiling children lined the unpaved roads on which our motorcade barreled forward—Friedland riding in VIP car #1. We were finally greeted at Ivanhoe’s Kipushi Mine by a full percussion band.

“Promoting a stock is like making a movie,” Friedland once said. “You’ve got to have stars, props, and a good script.”

The Kipushi Project was the world’s richest copper and zinc mining operation for the better part of the last century. But Kipushi was abandoned in 1993, and flooded in 2011. Ivanhoe then bought it for $150 million from Israeli businessman Dan Gertler. Ivanhoe’s been dewatering the mine since; drilling will target a potentially massive zinc deposit called the Big Zinc orebody.

Picture
Standing atop the 17 story shaft #5 at Kamoa overlooking Shafts #1-4 in the D.R. Congo’s Katanga province.
Early the next morning, we flew to Kolwezi, where Friedland’s crew had discovered Kamoa, the world’s largest undeveloped high-grade copper deposit.
Picture
Robert Friedland, David Broughton and David Edwards at the site of the Kamoa copper discovery in D.R. Congo
Today, the Kamoa camp is bustling, with some 300 local workers on site. The company aims for a 2018 start-up, but needs a financial partner, such as a sovereign or major miner, to come in with the cash.

Friedland expects to sell part of Kamoa to the Chinese or Koreans. The project is a behemoth that would require a smelter. But Friedland told me not to worry.

“World class ore bodies finance themselves,” he said. “In fact, people fight to finance them.”

I also talked to Friedland about his share price, which at the moment, was nearing all-time lows.

“Why do you keep pressuring me to promote the stock?” Friedland gestured to me. “This is getting built. Seven billion dollars for the Oyu Tolgoi mine in Mongolia and it was a thousand times tougher.”

Picture
Robert Friedland’s 100 kilogram baby, the Oyu Tolgoi copper and gold mine in Mongolia, which started shipping concentrates in 2013.
Since I returned from Africa, everybody’s been asking me what Robert Friedland is like in person.

The 63 year old Chicago-born, Singapore-based financier radiates intensity. He thrives in front of an audience. It always seems like he’s in a hurry, and his staff know better than to make him wait. Despite his age and lean frame, he is intimidating physically, and has piercing blue eyes. He has been married to Darlene, who was with us in Africa, for 33 years.

At the same time, he’s funny, sometimes goofy. He wears his hat backwards, uttering, “Be cool, be cool.” He makes a Japanese-style bow as he leaves the room.

The Ivanhoe Mines organization is surprisingly flat, and although Friedland is likely to interrupt his employees’ when they’re giving important presentations, they’re not afraid to tell him when he’s wrong.

Friedland made his fortune on quick flips, but has spent the past decade building mega-projects. My opinion is that he’s become more of a mine developer than a mining promoter. Building a mine is much more difficult than selling one undeveloped. At the Kamoa camp, as we are set to depart, Friedland shakes the hands of 300 workers and takes the mic to tell the men and women working there to make it happen.

Picture
Robert Friedland shakes the hands of workers at the Kamoa copper project, Feb 11, 2014. Photo: Tommy Humphreys
The reality distortion field is back in action.

Note: Travel from Vancouver to South Africa and all accommodations were paid for by the author, however flights to Limpopo and DRC and some meals were provided by the company. Statements made by representatives of Ivanhoe Mines were made in a Forward Looking context. Please read Ivanhoe’s Cautionary Note Regarding Forward Looking Statements carefully. Please note that any opinions, estimates or forecasts regarding Ivanhoe Mines’ performance does not represent opinions, forecasts or predictions of Ivanhoe Mines or its management. All facts are to be verified by the reader. This is not an investment recommendation or advice of any kind. Please read our full disclaimer. 

2 Comments

Bitcoin: A Joke or the Real Thing?

11/30/2013

1 Comment

 
Picture
COMMODITIES CORNER

Bitcoin has crossed the $1,000 barrier. Bitcoin is a virtual, decentralized currency that circumvents government regulation. It was the subject of two Senate hearings last week, and Fed chairman Ben Bernanke said virtual currencies "may hold long-term promise."

By Philip Springer


The FBI recently shut down Silk Road, an online marketplace where sellers offered drugs, firearms and other illicit goods and services, taking Bitcoins as payment.

Bitcoin's advocates aim to make it a universal electronic currency. By a wide margin, Bitcoin is the best known among dozens of alternatives, collectively known as altcoins. PeerCoin, Litecoin and Anoncoin are some other altcoins.

Probably the main reason for the Bitcoin buzz is its soaring value. A year ago, Bitcoin was worth a few dollars. In November alone, the price has climbed from $215 to $1,000 on Mt. Gox, the leading altcoin exchange. Meanwhile, Bitcoins were trading for $950 on Bitstamp, the second most popular exchange, and for $915 on BTC-e.

The supply of Bitcoins recently stood at 12 million, worth about $12 billion at recent prices.

SecondMarket's Bitcoin Trust "invests" in Bitcoins. SecondMarket is an online security brokerage specializing in illiquid assets. And at least one mutual fund is in the works.

Bitcoin is actually both a digital currency and a payment system. To get Bitcoins, you have to first set up a "wallet," probably online at a site such as Blockchain.info. You then pay a willing seller the necessary hard currency to transfer the coins into that wallet.

A growing number and variety of US merchants are starting to accept Bitcoins as payment.

The Silk Road closing highlighted a key Bitcoin attribute: theoretical user anonymity, which enables secret transactions of various kinds. A network keeps track of all transactions made using Bitcoins but it doesn't know who is using them or for what, just the computer "wallet" IDs. Yet every transaction is publicly available for anyone to examine in the "blockchain," a global, permanent ledger.

Strangely, the government of China evidently has endorsed the use of Bitcoin. Some say it's because of the hope that digital money will undermine the dollar's status as the world's reserve currency. A subsidiary of Baidu Inc. (NSDQ: BIDU), China's top search engine, started to accept Bitcoins last month.

Bitcoin supporters contend that it some day could become an effective alternative to government currencies or a cheap way to move money around the world.

But Bitcoin's manic price movements undermine its credibility as a currency. Real currencies usually have relatively stable values, making them good units of exchange. And Bitcoin already has numerous competitors.

In addition, the Bitcoin system evidently isn't completely secure. Numerous thefts of Bitcoins from encrypted accounts have been reported. These inevitably will grow in number with Bitcoin's popularity and, for now, value.

Bitcoin itself was invented in 2008 by one or more computer programmers using the pseudonym Satoshi Nakamoto. His, her or their identity is still unknown.

Altcoin values are set partly through complicated mathematical algorithms and partly by what people think they should be worth at any time.

Bitcoins are created, or "mined," by rewarding computer operators who solve a mathematical algorithm that grows increasingly difficult, which in turn slows the supply growth of Bitcoins. An algorithm limits the total number of Bitcoins ever mined to 21 million units, which is expected to occur by 2140.

It is extremely likely that governments ultimately will aim to regulate Bitcoin if its market gets big enough. Money is a tool of the state. Governments will not allow creation of an independent world currency outside of their control.

Meanwhile, it seems that the main reason people are willing to pay rising prices for Bitcoin is because other people also are willing to. Just like the Dutch tulip mania of the 17th century, probably the biggest financial bubble of all time.

1 Comment

One of the Best-Looking Trades In The Market Right Now

11/27/2013

1 Comment

 
Picture
I think I am finally joining Marc Faber and Warren Buffet's stance on precious metals; although platinum and palladium are still great buys and far below the cost of extraction.
COMMODITIES CORNER

I'm still tasting the sour results from the obviously manipulated gold market debacle. I had to maintenance over $80 grand on margin not to mention holding the bag on hundreds of shares of various gold royalty companies. I liquidated most of the dead weight but held onto three companies. I finally shed Harmony Gold (ADR) and rid myself of Seabridge Gold (SEA.TSE) prematurely. I recaptured 44% and made up the difference in Lionbridge Technologies (LIOX) and Diebold (DBD); two securities I have discussed and recommended before. LIOX is up 58% since my recommendation and DBD is up 15.7%.

By Jeff Clark 

It's either a massively stupid idea, or it's brilliant. Buying gold looks like a good trade right here, right now. 
I'm still wearing a black eye from my call for a huge gold-stock rally earlier this month. But that's not going to stop me from jumping back in the ring and taking a few more punches. The potential prize money is too big to ignore. Stop rolling your eyes and stay with me here for a minute while I explain the thinking...
 
There's an obvious contrarian trade here. Gold has underperformed the market this year. It has disappointed investors for so long that only the most diehard gold bugs are still onboard. Most investors have jumped ship and are sailing away with the stock market instead. Nearly every article I read this past weekend on gold predicted the metal would soon be trading at $1,000 or even $800 per ounce.
 
Sentiment just doesn't get much more bearish than that. So anyone looking to "buy low" has to be looking at gold right now.
 
There's also a "reversion to the mean" trade developing. After falling for 11 of the past 12 trading days, gold's proverbial rubber band is stretched far to the downside. Even a quick bounce just to alleviate the extreme oversold condition could be good for a fast move up toward $1,300 or so. That's a good trade. 
But what I like best right now is the setup on the weekly chart.
 
Take a look... Gold has support at the point of its late-June low at about $1,210 per ounce. Yes, gold dipped as low as about $1,170 in June. But this is a weekly chart. The data points are plotted based on the price at the end of the week. So $1,210 is our support level.
 
The red arrows on the chart below show the MACD indicator buy and sell signalsover the past two years. There's no need to get too complicated here. MACD is a simple momentum indicator. Buy signals occur when the black line crosses over the red line. Sell signals happen when the black line crosses beneath the red line.
 
As you can see, the weekly MACD indicator gave three signals last year. While they didn't pick the exact turning points in the price of gold, all the signals were profitable. 
Picture
We've only gotten one signal off this chart this year – a buy signal in July, when the black line on the MACD indicator crossed above the red line. That happened when gold was trading at about $1,320 per ounce.
 
So far, that signal is unprofitable. Gold is trading lower today than it was back then. But that's what gives us a favorable setup for a long trade in gold.
 
There's support at $1,210 per ounce. So traders buying here around $1,240 can stop out of the trade on a break of that support. That'll limit the risk to just over $30 per ounce. But we can use the MACD indicator to give us an even tighter stop loss on the trade.
 
Notice how the black line on the MACD indicator is just barely holding above the red line. The black line is either going to curl up from here – which can only happen if the price of gold rises – or it's going to immediately drop below the red line and generate a sell signal.
 
Traders can buy gold here in anticipation of higher prices. And they can stop out of the trade for a small loss if – at the end of the week – the black line on the MACD indicator is below the red line.
 
No matter what you may think of gold at the moment in terms of risk versus reward, this is one of the best-looking trades in the market right now.
 
Best regards and good trading,
1 Comment

We Have Seen the Bottom in Gold Stocks

10/25/2013

0 Comments

 
Picture
COMMODITIES CORNER


"We Have Seen the Bottom!" gold expert John Doody "shouted" in his Gold Stock Analyst newsletter on July 1. Gold stocks rose over the next few months, before falling back near their June lows. But all of a sudden, gold stocks are on the move again.

John's July call looks like it might be right after all. John has been writing about gold stocks for more than three decades. He's one of the smartest analysts in the industry. You hate to bet against him. Over the last 12 years, his gold-stock recommendations have resulted in 1,200%-plus gains (based on his audited track record). 

One of my favorite features of John's letter is his way of tracking whether gold stocks are cheap or expensive relative to the price of gold. It has proven to be incredibly accurate. When gold stocks are cheap according to his measure, you want to buy and right now, gold stocks are CHEAP!

Lately, gold stocks have been undervalued by 40%-plus. Based on history, we've only seen prices this cheap one other time – at the market bottom in 2008. Buying then would have led to 126% gains in six months.   In fact, any time John's measure got below 25% undervalued would've been a great time to buy. Take a look.
Picture
As the chart shows, big gains followed the last few times gold stocks got anywhere near this cheap. And remember, the only time they were really close to today's value – in 2008 – shares of the Market Vector Gold Miners Fund (GDX) soared 126% in six months.

I believe we're on the verge of a similar move right now. GDX is up as much as 12% over the last two weeks. Like John, I believe we've likely seen the bottom for gold stocks. This could be the beginning of a major leg higher. We have an opportunity for a great trade here with limited downside risk (14%) and triple-digit upside potential. 

To make this trade, you could buy the Market Vectors Gold Miners Fund and set a hard stop at the fund's recent low of $22.22. If shares fall below that level, sell the next day. You'll have given up 14% on the downside. If I'm right, and history repeats, you have triple-digit upside potential; possibly in as little as six months.  
0 Comments

What NOT To Do When Investing In Miners

10/23/2013

1 Comment

 
Picture
Precious metals miners are the most volatile stocks on earth. They're so volatile that investors often forget that underneath those whipsawing stock prices lie real businesses.

Mining isn't an easy business, that's for sure.
More miners fail than succeed. But some today
are executing their business plans well, selling gold and silver for more than it costs them to extract it from the ground. Yet their stock prices remain in the doldrums.

What should you do when you own stock in a business that's making good money, but the market doesn't seem to care?
COMMODITIES CORNER

Well, the most famous investor in history, Warren Buffett, encountered a similar situation during the financial crisis in 2008/2009, when his Coca-Cola stock tanked by 39%.

You don't need me to tell you that he didn't sell. He sat tight, content in knowing that the underlying business was strong no matter what value the market was ascribing to it. Coca-Coca has risen exactly 100% since then.

There are a handful of Coca-Colas scattered around the precious metals industry today, trading at dirt cheap prices despite their strong business performance.

Today's article is from Eric Angeli, broker at Sprott Global Resources and protégé of our good friend Rick Rule. Eric has solid advice on investing successfully in precious metals miners.

Without giving too much away, the key is to focus on the company itself and factors it can control,  rather than things it cannot control, like where the price of gold may go over the next 3-6 months.

What Top-Down Investing Gets Wrong

By Eric Angeli

If the past two years have taught us anything, it's that trying to predict short-term moves in the gold price can be a road to ruin. Parsing the umpteen countervailing forces that combine to set the price of gold is tough. And it's even tougher when you consider that oftentimes, market-moving news, such as a central bank trade, isn't reported until after the fact.

In my years spent evaluating natural resource companies as a broker and analyst, I’ve found that there are two ways to successfully invest in precious metals equities. Doing it right can bolster the strength of your portfolio, not to mention your own confidence in your holdings.

Method #1—Top-Down Approach You may have heard this method referred to as “Directional Investing.”

A directional investor decides that gold prices will increase in the long run. That's the starting point of his thesis. He then proceeds to find the companies that will be successful if his prediction comes true. He looks for companies with leverage to the gold price.

If an investor can get the timing right, this can be a lucrative strategy.

There is an obvious caveat, though: for this strategy to work, precious metals prices must rise.

In my role as a broker, I deal with both companies and investors all day long. I can tell you that most speculators involved with gold equities use this top-down approach.

That's why the number one question I’ve heard over the last three months has been, “Why isn’t gold moving up?” To directional investors, the answer to this question is paramount. This mindset leads to the herd mentality and, frankly, gives us our best bull markets.

I prefer method #2.

Method #2—Fundamental Approach Fundamental investors ignore prognostications about where gold prices might move next. We eliminate gold price movements as the crux of our investment decisions, which removes a lot of the guesswork from our portfolios. For a fundamental investor, gold prices are still a piece of the puzzle, but they are not the only driver.

Fundamental investors want to know: which company has a promising deposit in a relatively safe jurisdiction? Which has a tight share structure? This “bottom-up” method, however, does require a lot more homework.

Fundamental investing is all about identifying the difference between a stock’s intrinsic value and the price at which it is trading at in the open market.

While I do believe in higher gold prices eventually—and inevitably—I know that short-term movements in the price of gold are beyond my control. I instead prefer to position my clients for success in the current environment. Instead of focusing on when the gold price will move—which we can never know—we focus on picking quality companies.

Why Hasn’t the Top-Down Approach Been Working? You might say: because the price of gold hasn’t gone up! That's true, but there’s more to the story.

Until quite recently, gold has continued to rise, though not at the same clip we enjoyed after 2008. The problem is that miners' operating costs rose faster than the price of gold. Investors didn't expect that.

Nor did they factor in other cost increases. Sure, the value of a deposit rises every day the gold price rises. But did oil prices jump at the same time, making trucking the goods out more expensive? Did your laborers start demanding high wages? Did energy costs increase? Did the federal government demand a bigger slice of the pie?

Top-down investors can stop trying to figure out why they haven’t been correct over the last several years. They were correct on the gold price—but they ignored underlying cost factors.

This is where the Fundamental Approach shines. All of your investments should fulfill a few key checkpoints:
  1. Look for companies where management owns a large percentage of the stock. A vested interest at a higher share price is even better.
  2. Look for a tight capital structure. A bloated outstanding share count is a red flag. As is a history of management carelessly diluting away shareholder interest by issuing new stock.
  3. Look for a thrifty management team. A good company should spend their capital on projects, not swanky new offices.
  4. The company's mine should remain profitable even if gold drops to $1,000 per ounce. It could happen.
  5. Look for companies with enough cash to finance their current drill program, expansion plans, feasibility study, or construction phase. This year in particular, companies are having a very difficult time finding financing. Those who have adequate cash are diamonds in the rough.
  6. Know which countries support mining. A tier-one asset under the control of a wildly corrupt government isn't really a tier-one asset. You don't want to get caught in the middle of a government dangling final permits above managements’ heads.
  7. Know the geological potential of the exploration area. A four-million-ounce gold deposit is swell, but what if your company discovers not just one gold mine, but an entire new gold district? How will you factor in that upside?

Find a Source You Trust Mining companies have a fiduciary responsibility to make their shareholders money, so they can’t help but paint a rosy picture for potential investors. That's why you need to have a disciplined and impartial eye. Most companies are not worthy of your hard-earned capital.

Having an advisor you trust, or access to technical expertise, is crucial. Ideally you should have both. The most educated investor always has the edge. A source of trusted information is as rare as it is important.

If you prefer a more hands-on approach, Sprott offers complimentary portfolio reviews for investors. I'm fortunate enough to work alongside some of the world’s premier mining engineers and geologists. They have decades of experience ranging from running their own exploration companies to building out mining operations for large-scale producers. If you have any stocks in your portfolio that you're unsure about, give us a call and ask for a portfolio review. It's that simple.

I'll conclude with this: the markets have not been kind to the miners recently. But selling a stock just because it dropped in value is an emotional decision. Seeing red on your computer screen is painful, but it is not relevant. What is relevant is what you do with that capital going forward. Don't let emotion cloud your judgment.

On the other hand, if you’re waiting for the gold price to move higher before you sell, then you’re a speculator masquerading as an investor, and you may as well buy a ticket to Vegas.

My boss and mentor, Rick Rule, recently said, “Bear markets are the authors of bull markets.” When these markets do start moving, if you’re not positioned with the highest-quality tier-one companies, you could miss out on one of the biggest bull market moves of your investing life.

Eric Angeli is an investment executive at Sprott Global Resources. You can reach him at eangeli@sprottglobal.com or by calling 1.800.477.7853.

1 Comment

Titanium Ore Looks Promising

10/15/2013

1 Comment

 
Picture
COMMODITIES CORNER


Tronox Limited (TROX) is a $2.72 billion basic materials company that produces and markets titanium ore and titanium dioxide in the Americas, Europe, and the Asia-Pacific. TROX had set up in a very bullish ascending triangle pattern throughout most of the summer before breaking out on strong volume in mid-September.

The measurement of this pattern was $27.00, which was reached within a week of the breakout. Since that time, TROX has been selling off on lighter volume. It’s approaching support near $23.00 with a daily MACD nearing centerline support and an RSI now below 50.
Picture
Action To Take: I like the reward to risk on initial entry at the current price with second entry at $23.40. Consider a closing stop below $22.90 with a target back near the $27.00 level.
1 Comment

A Shocking Energy Prediction and What to Do About It Right Now

10/10/2013

1 Comment

 
Picture
COMMODITIES CORNER


By Frank Curzio, editor, Small Stock Specialist

"Within 20 years, we will no longer need to import oil from overseas."   Last month, I spoke with Dr. Kent Moors on my radio podcast. We talked about an idea I've been following for years. New technologies – like fracking and horizontal drilling – have allowed the U.S. to tap into incredible oil and gas reserves.


My research team and I have gotten a close look at these technologies over the last 12 months in the Permian Basin, Eagle Ford, and the Bakken Shale. This has led to a huge oil boom in America. In 2011, the U.S. was producing 5.5 million barrels of oil per day. Today, it's producing 7.5 million barrels per day. That's a 36% increase in oil production in just two years. And it's the most oil America has produced in 25 years.  

Despite this massive boom, the U.S. isn't even close to producing enough oil to meet current demand. But Dr. Moors argues we will be soon. And even if he's half right, a few key players are going to reap enormous rewards.

Americans consume about 18.5 million barrels of oil per day. To reach energy independence, we'd have to increase production by 11 million barrels of oil per day. That's why Dr. Moors' prediction – that in 20 years, the U.S. will no longer need to import oil from overseas – was so shocking. 

Dr. Moors is one of the smartest oil analysts in the field. He's a consultant to the world's largest energy companies. And he's basing his call on the latest planning document from the Organization of the Petroleum Exporting Countries (OPEC). OPEC is an oil cartel made up of mostly Middle East countries, and its purpose is to coordinate oil policy. The document projects that not a single member of OPEC will be exporting oil to America a few decades from now.  

In other words, the largest oil-producing nations believe America will be energy independent in the not-so-distant future. For the U.S. to become energy independent, it would likely have to open up more shale areas in New York, California, and Florida. It would also have to drill for oil in the Three Forks (under the Bakken shale), the Cline (in the Permian Basin), and the Utica (located under the Marcellus shale).   Dr. Moors also suggests that the U.S. will import about 30% of its oil from Canada.

That means the U.S. will need to produce about 13 million barrels of oil per day to meet current demand – 5.5 million barrels more than current production levels. I'm not sure we'll get there in 20 years. But if the U.S. opens up more shale areas and starts importing fewer barrels of oil from overseas, many companies will be huge beneficiaries. I suggest buying some of the largest shale oil producers, like Continental Resources (CLR) and Pioneer Natural Resources (PXD).

These companies drill in the Bakken, Permian Basin, and Eagle Ford – and their oil production numbers are already skyrocketing.   Oil-service firms – like Schlumberger (SLB), Baker Hughes (BHI), Weatherford (WFT), and Halliburton (HAL) – will also be winners. These companies sell drilling equipment and services to energy giants like ExxonMobil and Chevron.  

My favorite pick is Halliburton – which I believe will be bought by General Electric over the next 12 months.   As America pushes to become energy independent, these companies will likely put money in investors' pockets.  


Further Reading:
The Most Important Chart for Oil Investors to See

By Matt Badiali, editor, S&A Junior Resource Trader

Each new number out of the oil sector is bigger than the last. As longtime readers know, we're in the middle of an energy revolution. The technology is advancing so quickly, it's like moving from the Model T to the Ferrari in just a few years... and it's helping the U.S. tap incredible reserves of oil and natural gas.


The latest forecasts are out and they're shocking. If you own energy stocks, you have to see this chart.  According to the U.S. Energy Information Administration (EIA), domestic crude oil production will hit 7.8 million barrels per day by 2014. That's the highest production since 1988. It represents an astonishing 56% increase from the recent low of 5 million barrels per day in 2008. This chart below shows exactly what I'm talking about.
Picture
To put that in perspective, the increase alone will be enough to supply all of Russia's oil demand. It's nearly enough oil to supply the entire continent of Africa. In fact, it's more than enough oil to supply any country in the world except the U.S., China, India, and Japan.  

What does this mean for investors?  Get cautious. As domestic production increases, the U.S. requires fewer imports. (Oil imports are already at their lowest point since 1998 and falling.) That removes a huge chunk of demand from the global market. Prices will drop dramatically. The EIA is forecasting an 8% decline in the global oil price and a 15% decline in 2014. 

If you own high-cost producers – companies that have to spend a lot of money to pump a barrel of oil – you should cut them loose. Take Suncor (NYSE: SU), for example. Suncor is the "poster child" of Canada's oil sands. These energy deposits are tough to mine.

According to Bloomberg, it cost Suncor $139.94 to produce one barrel of oil in 2011 (the most recent data available). Compare that to ExxonMobil (NYSE: XOM) – the world's best oil company – which spent just $9.44 a barrel on average. When you have to spend a lot of money to produce oil, you make a lot less selling it. Suncor's profit margin was just 7.3% in 2012, even with high domestic oil prices.

This company could begin to lose money if oil prices fall even slightly. Many other oil producers are in the same situation. If you own any high-cost producers, take some money off the table and protect yourself. The oil production numbers we're seeing today are extraordinary... and they're just going to get bigger.  
1 Comment

Canadian Oil Rides the Rails

10/10/2013

2 Comments

 
Picture
First Oil Well in Western Canada
COMMODITIES CORNER

Canadian regulators continue to evaluate
Enbridge's (NYSE: ENB) proposed C$5.5-billion
Northern Gateway pipeline, which would pump
crude from the Alberta oil sands to the Pacific coast
at Kitimat, B.C.

The 1,170-kilometer line is important for oil sands
producers, because it would carry an average of
525,000 barrels a day, which would be loaded onto
tankers and shipped to Asian markets.

However, the project has met resistance from
Aboriginal and environmental groups. It's not clear
which way regulators will lean, but the company
expects the thumbs-up or thumbs-down by
mid-2014. If all goes well, Enbridge says it
 will have the line up and running by 2018.

By Chad Fraser

CN Rail to the Rescue?

Canadian National Railway (NYSE: CNR), the country's largest railroad operator, appears to be contemplating a fallback plan in case Northern Gateway is nixed—or at least it was back in late February.

According to a September 22 report from the Canadian Press, an internal government briefing note obtained under the country's Freedom of Information Act indicated that CN was considering shipping crude from Alberta to Prince Rupert, B.C., where it would be loaded onto Asia-bound tankers.

The note, which was dated February 28, 2013, said the company was working with oil sands producer Nexen on the idea at the time. Nexen, you may recall, was taken over by Chinese petrochemical giant CNOOC (NYSE: CEO) last year in a $15.1-billion deal. Notably, CN points out that it would be capable of matching Northern Gateway's capacity.

CN already has track running to Prince Rupert's Ridley Island, but there are other stumbling blocks. "The concept would require the construction of an oil trans-loading facility in Prince Rupert, which does not currently exist,” reads the note. In addition, the note points out that there is a 2.5-year waiting period for new tanker cars, which are typically leased to railways.

Oil by Rail Continues to Grow—But Tragedy Weighs
Still, the existence of such a plan speaks to both how much the shipment of oil has grown over the years and the extent of demand for new ways to move Canadian crude to market.

According to recent figures from the Railway Association of Canada quoted in the Calgary Herald, up to 140,000 carloads, or 230,000 barrels per day, of crude oil and bitumen from the oil sands will be shipped by train this year, up from just 500 carloads in 2009.

Shipping oil by rail costs about $5 to $10 more per barrel compared to pipelines that are already built, but the oil trains are helped by the spread between crude prices. If the spread narrows too much, rail becomes less viable compared to pipelines. Right now, for example, the differential between international Brent crude and West Texas Intermediate (WTI) has narrowed to around $6.70, while Western Canada select is sitting at a roughly $33 discount to WTI.

The safety of shipping oil by rail has also been called into question in the wake of the July 6 tragedy at Lac-Mégantic, Quebec, in which an oil train operated by the Montreal, Maine and Atlantic rolled away after it was left unattended for the night. It then sped downhill, derailed and exploded in Lac-Mégantic, killing 47 people.

The incident has spurred calls for tighter rail-safety regulations, which could significantly increase railways' costs.

Canadian National: A Broad-Based Northern Rail Giant
Canadian National is Canada's largest railway, with about 20,400 route miles in eight provinces and one territory. It also owns track in the U.S. that extends to the Gulf of Mexico.

The company began life in 1918 as a crown corporation (the term for a state-owned company in Canada) and was privatized in 1995.

While the oil-by-rail boom has grabbed a lot of headlines, it's important to keep in mind that oil is just one part of most railways' operations, including Canadian National's. In the latest quarter, for example, petrochemicals accounted for just 19% of CN's total freight revenue.

The largest slice came from intermodal, or containers that can be loaded onto ships, trucks or trains (23%), followed by oil, then grains and fertilizers (16%), forest products (15%), metals and minerals (13%), coal (8%) and automotive (6%).

Overall intermodal shipments continue to rise due to the cost effectiveness of shipping goods by train. As a January Zacks.com report points out, railroads are estimated to be around 300% more fuel efficient than trucks. At the beginning of the year, intermodal accounted for 20% of all railroad revenue, second only to coal.

Oil Provided a Second-Quarter Boost
In the second quarter, Canadian National's revenue from shipping petroleum and chemicals surged 18% from a year earlier. Metals and minerals gained 5%, forest products rose 4% and intermodal gained 3%. Coal revenue was flat, while automotive revenue declined 3%.

It all added up to an overall revenue increase of 4.8%, to C$2.67 billion from C$2.54 billion a year ago. Net income rose 13.6%, to C$717 million, while per-share profits rose 17.4%, to C$1.69, on fewer shares outstanding. Without one-time items, the company earned $1.66 a share, up from $1.50 and topping the consensus forecast of $1.62. Revenue just missed the expected $2.70 billion.

Canadian National's operating ratio—a measurement of railway efficiency—continues to be the lowest in the industry, at 60.9% in the latest quarter, down from 61.3% a year ago. (Operating ratio is operating expenses as a percentage of revenue.)

Former CN Boss Now Heads Its Chief Competitor
The company faces strong competition from rival Canadian Pacific Railway (NYSE: CP), which is now headed by former CN boss Hunter Harrison after activist investor Bill Ackman pushed for Harrison's installation as CEO in the wake of a proxy fight last year.

As he did at CN, Harrison is now focused on cutting CP's operating ratio. CP ended the second quarter with an operating ratio of 71.9%, down from 82.5% a year ago.

CP shares have surged 44% on the New York Exchange in the past year, in the wake of Ackman's boardroom success and the company's ongoing restructuring, compared to a 14% gain for CN. However, CN Rail's shares are less volatile than CP's with a beta rating of just 0.94 versus 1.53 for CP. (Stocks with a beta rating of 1 are as volatile as the market, while those below are less volatile.)

CN also trades at 17.1 times its last 12 months of earnings, compared to 30.1 for CP. In addition, CN carries a higher dividend yield, at 1.60% vs. 1.10% for CP.

Both companies are in good position to ride a continued North American recovery and expected rises in both oil and intermodal shipments. Investors will get a peek at how both trends are playing out in Canada when the pair report their latest quarterly earnings in two weeks.

2 Comments
<<Previous

    RSS Feed

    Archives

    December 2014
    February 2014
    November 2013
    October 2013
    September 2013
    August 2013
    July 2013
    June 2013
    May 2013

Powered by Create your own unique website with customizable templates.