By Serge Berger
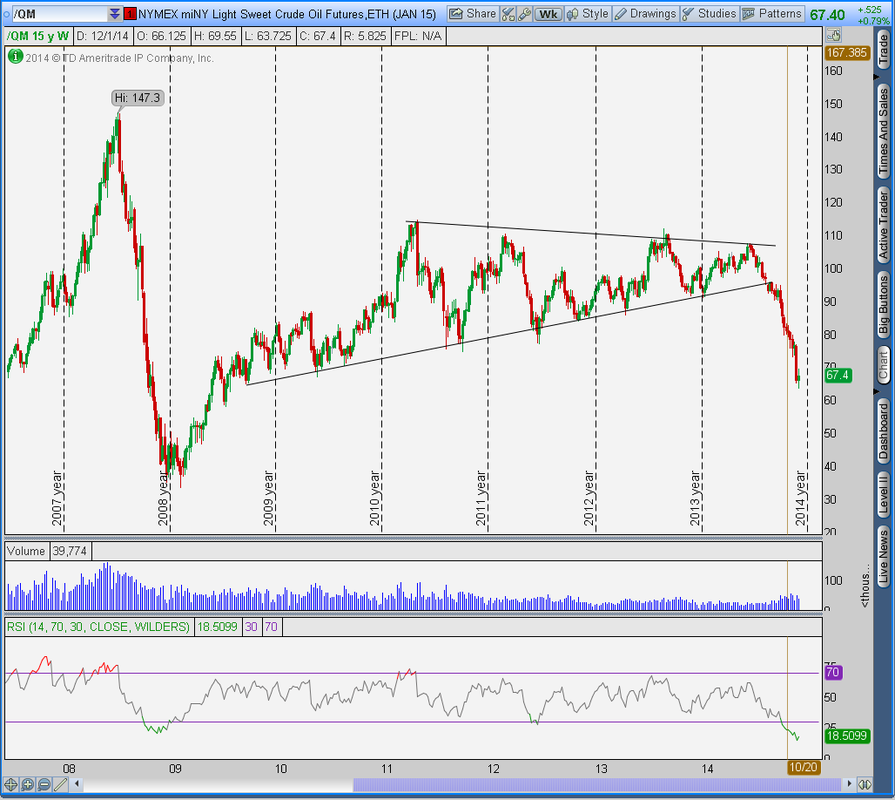
We all know it, it’s all over the news: the price of oil is dropping precipitously. Of course as these things go by the time the headlines are over it, it usually is time to take the opposite side of the trade, at least from a near- to medium-term perspective.
Lower oil prices, however, can have wide-ranging consequences, from a discount to the consumer to economic hardship and even social unrest in major oil-producing emerging markets.
We don’t have to look far for evidence that — as Mark Twain is credited for saying, “history does not repeat itself, but it rhymes” — as we consider the economic challenges that Russia faces as of late, worsened by the dramatic fall in oil prices and a collapsing currency.
When it comes to profiting in the markets, investors and traders alike must be able to distinguish between different time frames and what the fundamental, structural and technical pictures are saying.
For a few weeks to possibly a couple of months, the price of oil increasingly looks to be oversold and ripe for a better bounce. This in turn could also lead to a bounce in oil-related stocks as the correlation between oil and stocks is high.
Click to Enlarge
Cheap Oil Stocks: Diamond Offshore Drilling Inc (DO)
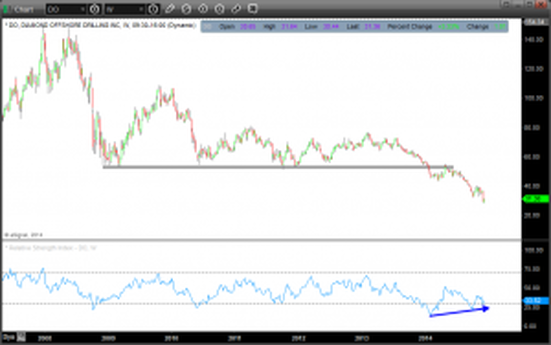
Shares of deep water oil drilling company Diamond Offshore Drilling Inc (DO) have been declining since topping out in 2008, so the continued sell-off in 2014 is nothing new. The price action in early 2014, however, broke the stock below a support line that stretches back to early 2009.
Unlike what traditional technical analysis would have one believe, such big picture support breaks in the aggregate lead to better bottoming phases rather than new multi-year down moves.
Case in point, the multi-year chart shows that momentum as represented by the Relative Strength Index (RSI) bottomed in January as DO stock broke below support but has since formed a series of higher lows, thus giving us positive divergence between momentum and price and indicating that a better bottoming process may be developing.
Tactically, once DO stock can wiggle itself back above the $32 area it stands a better chance of strutting higher toward the $35-$36 area into year-end. When it does that, it is an oil stock to buy.
Click to Enlarge
Cheap Oil Stocks: Transocean LTD (RIG)
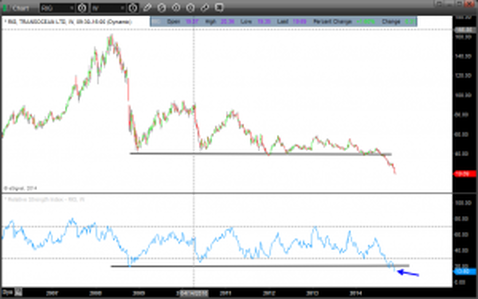
Shares of oil drilling company Transocean LTD (RIG) have taken a similar fate to that of Diamond Offshore Drilling — since topping out in 2008 it has only trended lower.
To put the multi-year drop in perspective, note that since the 2008 drop RIG stock has fallen about 88% and now sits at levels not seen since 2004.
Looking at the Relative Strength Index (RSI) at the bottom of the chart, note that while we are not seeing any positive divergence between momentum and price as we do in DO stock, the RSI indicator with a reading below 13 is now the most oversold it has ever been.
This likely argues for a mean reversion bounce in the near future. Here too however, RIG does need to first show us that it can stabilize before a good entry for a bounce makes sense.
Given the steep drop and historically deep oversold readings it likely is only a matter of time until such a bounce occurs, which once the stock can overcome the $21 area could quickly lead to a move back toward the $23-$24 area, making it an oil stock to buy.
Click to Enlarge
Cheap Oil Stocks: Market Vectors Oil Services ETF (OIH)
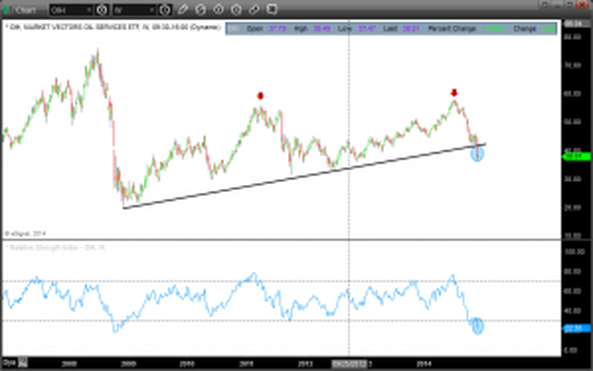
Shares of the Market Vectors Oil Services ETF (OIH), a diversified oil services fund, given the carnage in the price of oil and oil services stocks of late has also taken a beating since topping out in July.
The OIH has dropped more than 35% since the July top, which also resulted in the ETF snapping its late 2008 support line and in oversold readings in the RSI not seen since then.
Investors and traders looking to consider playing an oversold bounce in oil via the oil services stocks, instead of stock picking may just want to look at this ETF. Important to keep in mind is that with the recent spike in volatility in oil related stocks, correlation among those stocks has risen as well.
This is to say that any oversold bounce is likely to lift the entire group of stocks and buying an ETF could just simplify the trade. For the OIH, a move back above $39 could send this stock back into the low $40s into year-end, which would also serve as a good re-test of the aforementioned broken longer-term support line.
Click to Enlarge


 RSS Feed
