The Millionaire Maker Investment Advisory
  • Introduction
  • Market Conditions
  • Commodities Corner
  • Featured Interview
  • Understanding Markets
  • Understanding Money
  • Understanding Value
  • The Tax Shelter
  • Retire Rich
  • Radio Blog
  • Contact

Chinese Gold & Silver                                                         Exchange Society Runs Out of Gold

5/19/2013

7 Comments

 
Picture
COMMODITIES CORNER


Hong Kong’s Chinese Gold & Silver Exchange Society has been in operations for over a century, and it’s President Haywood Cheung was interviewed by Bloomberg news earlier today. 

Whoever orchestrated the attack on gold and silver in the last week or so has gravely miscalculated, since the response to the drop has been surging demand for physical gold and silver.  While I tend to be skeptical when I hear about silver shortages since these reports have been so exaggerated in the past, the lack of silver coin availability and premiums are the most extreme I have seen since the financial and economic meltdown of 2008. 

Now we discover that the Chinese Gold & Silver Exchange Society has essentially sold out of gold bullion, and must wait until Wednesday for shipments to arrive from Switzerland and London.


Click link below for Bloomberg News Video:
http://libertyblitzkrieg.com/2013/04/19/chinese-gold-silver-exchange-society-runs-out-of-gold-importing-from-switzerland-and-london/
7 Comments

Gold and Silver: Sentiment Reversal is Inevitable

5/19/2013

1 Comment

 
Picture
COMMODITIES CORNER

The usefulness of sentiment's stealth crystal ball is about to be revealed to the litany of unsuspecting precious metal bears and skeptics who have convinced themselves that gold's bull market is either over or, at the minimum, in need of lengthy ongoing retesting, restructuring and consolidation.

This article will bring us up to date as to the degree of current bearish sentiment regarding both gold and silver using no fewer than 5 sentiment indicators (with 9 illustrative charts), as well as provide the reader with an opportunity to observe the price outcome of previous bearish extremes using these sentiment indicators.

When we begin the sentiment indicator discussion we will look at charts of the put/call volume ratio (options) of SPDR's Gold Trust ETF (GLD) and iShares Silver Trust ETF (SLV), then examine Hulbert's Gold Sentiment Index, followed by the Blees Rating, then gold's Commercial and Non-Reportable (futures) traders positioning detailed in the most recent Commitment of Traders Report (COT) from the CFTC, and conclude with a daily gold futures price chart that includes the corresponding readings of the Ulcer Index indicator.

But first, let's briefly consider the concept of investor sentiment.
My observation is that sentiment's crystal ball, particularly when observed at an extreme, works reliably despite conflicting and clever arguments of either a technical or fundamental nature, and plays the ultimate trump card in foretelling a market's reversal of price direction. Sometimes the occurrence of a high volume "capitulation selling" event provides the most obvious observation of sentiment exhaustion. But there are numerous other means to assess this phenomenon and we will get to these shortly. 

Sentiment extremes, simply put, tell us that there are too many traders at one end of the boat and therefore the boat is about to tip over. Sentiment can strongly suggest that the trade, as some say, has become "crowded". When someone finally yells "fire" in the "crowded" room there are so many of the market's participants motivated to get out the same door and in the same direction that most get

trampled - unable to reverse their trade fast enough. 

Another way of characterizing a sentiment extreme is to say that the trade simply runs out of buyers or sellers, as the case may be. The extreme price momentum in one direction "exhausts" itself of all available ammunition to continue the trend and is sometimes signaled when someone yells "fire" in the "crowded" room, but often comes to a conclusion unrecognized by most traders as price reverses direction in an unassuming manner.
Yet another saying is "when everyone is thinking the same thing, then no one is thinking". The sentiment indicators we will look at today will give us a clear sense as to whether this saying is potentially a significant and foretelling factor in future precious metal price movement.

And yes, there are indeed two players for each trade - the buyer and the seller. In our present precious metals situation, this leads us to consider the concept of shares moving from "weak" hands to "strong" hands.
The Claude Resources (CGR) shares I have been accumulating and holding with a considerable draw down are in "strong hands". Barring some unanticipated but significant company news, I have resolved to not sell any of my position even if price should continue to fall from the current $0.30 per share to $0.10. 

However, as Claude Resources share price has fallen from about $1.00 last September to around $0.60 last January and just a couple months ago $0.50, obviously there have been too many shares of CGR still held by "weak hands". This will change because when the last "weak hand" is willing to sell their last share at this incredibly exaggerated market price, that obviously, will be the bottom.

You may have heard comments when a particular market bottoms and then begins to trade higher and then continues to trade even higher yet,despite "bad" news, the assertion that the bullish price movement seems to make no sense - that it cannot possibly be sustained. At this time it appears to nearly everyone the common sense question to ask is how "bad" news that used to cause a market to go into free fall now seems to have absolutely no negative effect? And to observe that as this market continues higher, it always leaves behind those traders stuck in pessimism to declare that the market is "climbing a wall of worry". That is, the "bad" news continues in the media, yet this particular market's price reversal continues upwards.

These thoughts are precisely what make this article's argument dead on target, in my opinion. That is, sentiment at extremes can and often does trump both technical and fundamental analysis. We are about to examine a number of these sentiment indicators which will leave little doubt that the precious metals market is presently at a sentiment extreme of historical proportion.
As markets usually swing from one price extreme to another, and markets usually swing from one emotional extreme to another (such as fear to greed), I believe the following sentiment indicators and their readings literally guarantee the continued reversal of gold and silver price to the upside.

So let's now take a look at the 5 sentiment indicators I have prepared for detailing the current gold and silver market sentiment and see what they are telling us.
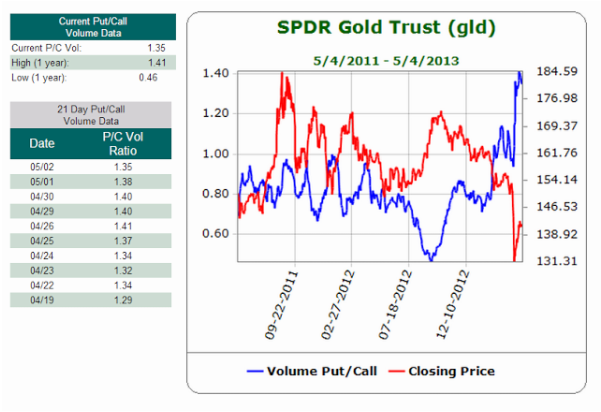
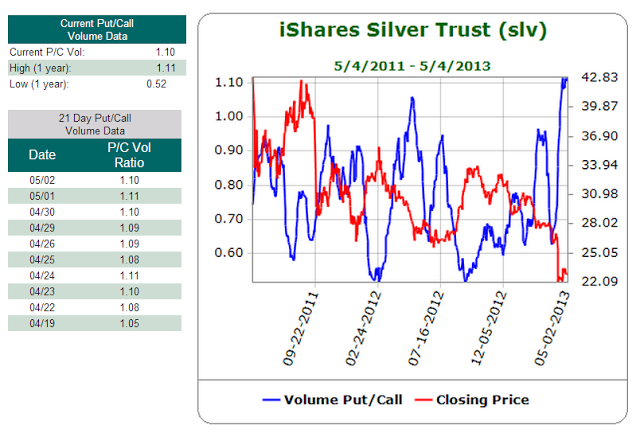
We will begin with the put / call volume ratio of the options trade of the SPDR Gold Trust ETF (GLD) and iShares Silver Trust ETF (SLV).  Charts courtesy of Schaeffer's Investment Research.
Picture
The red line in the charts are the ETF's price movement over the recent 2 years (GLD above, SLV below). The blue line is the put / call volume ratio. This considers the trading day's volume of puts traded and is divided by the volume of calls traded. Generally, the higher the put / call ratio, the more bearish traders are about the ETF's likely price movement, while the lower the put / call ratio, the more traders believe the ETF is bullish and going to rally higher.
Picture
Undoubtedly you have noticed that both charts reveal that the put / call ratio is at the highs of the past two years; meanwhile price is at the lows of the past two years. I will leave it to you to observe the repetitively flip flop relationship between this sentiment indicator and price movement. For me, anyway, this indicator leaves little doubt as to the upcoming direction of GLD and SLV. 

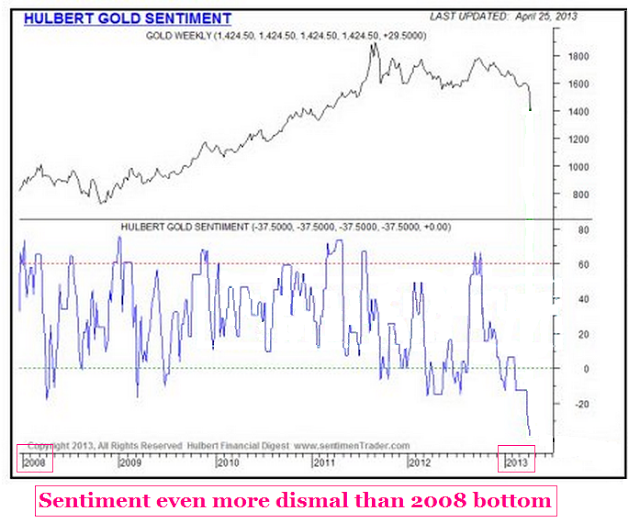
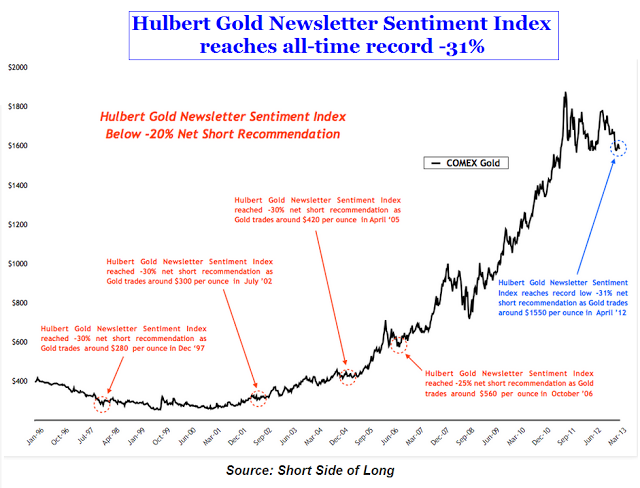
Next up is the Hulbert Gold Sentiment Index. This chart courtesy of Mark Hulbert's Newsletters. The chart that follows this first chart is courtesy of Short Side of Long.
Picture
This first Hulbert Gold Sentiment Index chart shows us that gold sentiment at present is even more depressed than at gold's infamous 2008 low.
Picture
The second chart offers a sweeping view of gold's price movement over the past 17 years, as well as the locations of noteworthy extremes of bearish sentiment. And incredibly (and once again) our current bearish sentiment breaks all previous records with a reading of -31%. Now we will turn to the Blees Rating with another pair of charts. The Blees Rating is simply a calculation that uses the COT report data on the positioning of commercial traders in comparison to their positioning 18 months previously. 

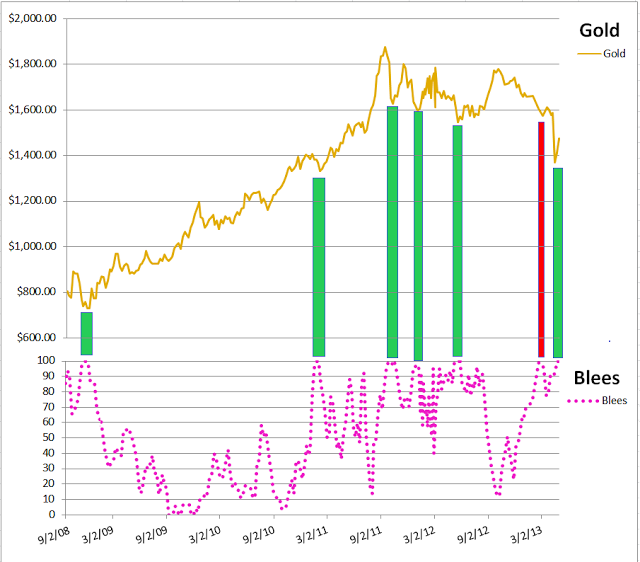
The first chart is one that I made. It looks at the price movement of gold since September 2008 in the upper portion of the graphic, and displays the corresponding Blees rating in the lower portion of the graphic. The Blees rating this week, for the second week in a row, is 100. The greenbars I added to the chart are intended to draw your attention to price action once a Blees rating of 100 is triggered.
Picture
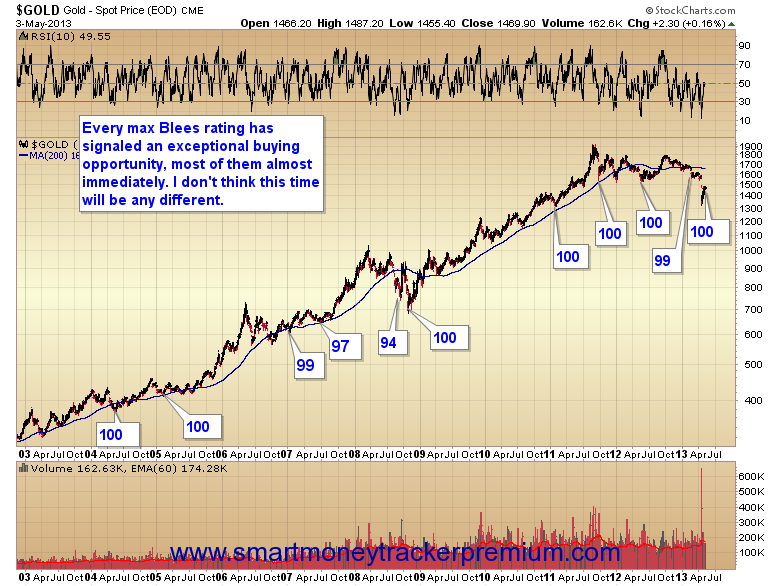
The red bar I added connects a Blees rating of 99 with price just before our infamous episode of a two day price crash in gold. Though I neglected to add another red bar in September 2008, you will notice that nearly the same thing happened at that time. That is, the commercial traders bellied up to the bar with a reading of 94 then apparently and correctly smelled a rat. They backed off and price indeed made one final swoon. Then in early November 2008 they bellied back up to the bar and held a 100 Blees rating for 2 consecutive weeks followed by another week at 99. They nailed the true bottom. I have no doubt they have done it in 2013, as well.

The following chart of $GOLD courtesy of SmartMoneyTrackerPremium details the locations of the maximum Blees rating since 2003.
Picture
Our next pair of charts looks at the positioning of gold futures traders as reported in the most recent Commitment of Traders (COT) report. Both charts are courtesy of GotGoldReport by Mr. Gene Arensberg. 

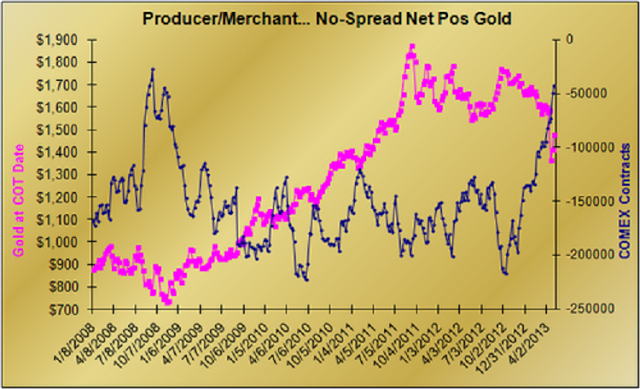
First up is the commercials (dark blue line) and their net positioning of gold futures contracts since 2008. The price of gold is shown in magenta.
This group of traders is considered the smartest of the players and are hedgers by nature. It is indeed rare to find their net positioning anywhere near to just slightly short, as they are now positioned. Incidentally, they are now positioned exactly as when they correctly called the 2008 bottom.
Picture
In Mr. Arensberg's accompanying dialog with these charts he noted that the commercial traders method of operation is to add shorts as price rises and add longs (or sell shorts) as price falls. But interestingly, as gold has been raising $150 over the past two weeks, the commercials have been doing just the opposite of their norm. Instead of adding to their shorts as price has gravitated higher, they have reduced their shorts and added to their longs.

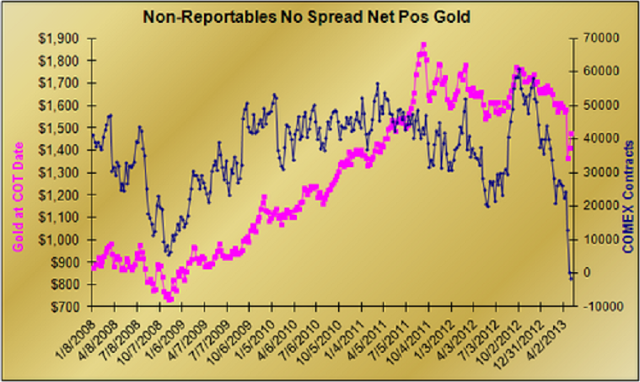
Yowzer! My take is that the commercials are essentially saying to the market, "bring it on". Now for the chart of the little guys trading gold futures, otherwise known as the non-reportables.
Picture
You can see that for the first time since 2008 this group (sometimes also known as the 'dumb money') has a net position that is just barely short (below ZERO). In effect, this group does not have any skin in the game and that has not been seen before. They have been suckered into losing their net long position and will have to buy, buy, buy when they figure out the trend is up.

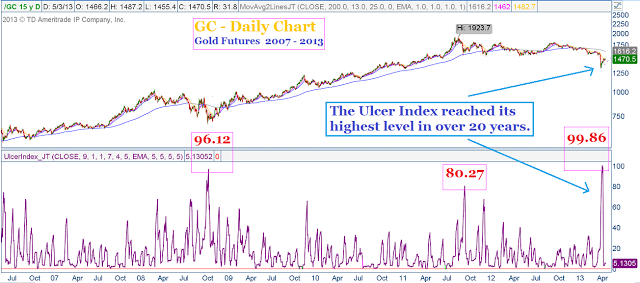
And finally we conclude our pondering of 9 charts with this daily chart of gold futures (/GC) from 2007 and forward. I created this chart and have added in the lower panel the Ulcer Index indicator. This is a volatility indicator that measures downside risk. The higher the indicator reads the higher the risk is considered to be if one continues to hold 'Old Turkey'. 

From a sentiment point of view, the higher the indicator reads the scarier the ride for the long investor. I looked at this indicator on the daily gold futures chart back 20 years and I can tell you what we just experienced was the first place roller coaster drop of the past 20 years. If you still have your lunch (like me) you are likely qualified as a "strong hands" investor.
Picture
So there you have it. Sentiment on GLD and SLV options is crazy extreme, Hulbert's Gold Sentiment Index reveals sentiment is not only more bearish than the 2008 bottom - it's more bearish than anytime in the past 17 years (at least). The Blees Rating has been at the max of 100 for two consecutive weeks.

The smart money commercials of the Comex gold futures market, despite the $150 rally we have had off the capitulation low a couple of weeks ago are not being shy. Price has been going up and they have just added to their long positions and reduced their short positions. Meanwhile the non-reportables have played themselves right off the field and will have to become buyers to get back in the game. And finally, the Ulcer Index confirms that gold has taken a hit that should have left EVERYONE running for the door.

You know, I don't make this stuff up. And after putting about 10 hours non-stop into making this article what it is, I have nothing more to say other than encourage you, another time, to consider the evidence that sentiment plays a powerful role in the trading markets and that if there was a better precious metal setup than the one we presently have - I simply do not believe it.
1 Comment

The Enduring Glow of Gold

5/19/2013

0 Comments

 
Picture
COMMODITIES CORNER

“Yes, gold doesn’t bear interest. Many, including Warren Buffett, belittle its investment value. But, paintings or antiques don’t bear interest either. When money supply is rising, anything scarce tends to rise in value. Gold is the best scarce commodity in the world. There are more artists that can paint more paintings every day. 80% of the world’s gold has already been extracted. The remaining 20% will be dug up in the next 20 years. The money supply will grow forever. But the gold supply can grow only by 25% and no more.”

Despite ripple of skepticism, gold is the ultimate hedge on inflation
By Andy Xie

BEIJING  — The global economy has already entered into stagflation with a growth rate of 2% and inflation at 3%. The inflation rate is likely to rise above 4% in 18 months while the growth rate will remain stuck in the same range. With inflation twice as high as the growth rate, the global economy will slip deeper into stagflation. The recent decline in commodity prices doesn’t signal a reversal in the inflationary trend. It is a onetime redistribution of mining income to consumer purchasing power.

The prevailing negative real interest rate channels monetary growth above economic growth into inflation wherever there is shortage. Manual labor in emerging economies, skilled labor in the developed economies, agricultural commodities, rent, healthcare, education, etc., are leading the inflationary trend.

Inflation expectations are already a self-reinforcing influence on emerging economies such as India. It will take root in developed economies. When this occurs, the global economy will run into an inflationary crisis as a result of wrong-headed policies used to deal with the financial crisis.

Multinational companies remain the biggest beneficiaries of the current global environment. The macro instabilities give them opportunities to arbitrage the frequent fluctuations in demand and production costs across the globe. The negative real interest rate has boosted their profits significantly, too.

The real interest rate is probably minus 2% in the world today. It should be in line with the per capita income growth rate of 1%. The difference is 3%. This environment redistributes wealth from savers to debtors on a scale of over $2 trillion per annum or $55 billion per day. This must be the biggest legal robbery ever in human history.

Speculative capital also profits from the mismatch between economic challenges and policy responses. The global economy needs flexibility on the supply side to handle the dislocations from globalization and technology development.

The primary policy response so far is the use of monetary stimulus, in the hopes that a demand kick will snowball into a virtuous cycle in each national economy. For the past five years, it hasn’t worked to achieve its main objective. But it has created big fluctuations in asset markets, giving speculative capital a golden opportunity to engage in the biggest wealth redistribution in modern history.

Despite its recent setback, gold (CNS:GCM3)  remains a big beneficiary of the current macro environment. It could make a new high in the current year and rise much higher in 2014. The gold bull market will end when an inflation crisis pushes central bankers around the world to tighten aggressively.

Stagflation is now The emerging economies exhibit significant symptoms of stagflation. All major emerging economies are facing significant slowdown. But the attempts to stimulate are checked by inflationary problems. The International Monetary Fund projects a 5.5% gross domestic product growth rate in 2013 for emerging economies. The Q1 data suggests a much weaker year. I see 4% for the year.

The broadest inflation gauge, the GDP deflator, is likely around 6%. Emerging economies are easing monetary policy on the whole, just haltingly to demonstrate some credibility on inflationary concerns. But the easing policy remains the main trend. It is likely that inflation will surpass twice the GDP growth rate.

The U.S. economy grew by 1.7% in 2012 with GDP deflator, the broadest inflation gauge, at 2.4%. In the first quarter of 2013, it reported a 2.5% rate, of which 1% came from inventory accumulation, and GDP deflator at 0.9%. It appears that the U.S. economy is stuck at a 2% growth rate and GDP deflator is slightly higher.

The U.S. economy is experiencing a mild form of stagflation. The high unemployment keeps wage under control. But, shouldn’t one be concerned about the significant inflation pressure despite such a weak economy? As a mismatch remains a major force in the U.S. unemployment picture, wage inflation is quite possible in many pockets. Energy and agricultural industries already face such pressures.

Both the IMF and the Organisation for Economic Co-operation and Development project a 1.4% GDP growth rate for developed economies. The Q1 data suggests that this is just too optimistic. I think 1% is more likely. While weak growth is disinflationary, momentum and imported inflation are significant forces. The whole OECD block is likely to be similar to the U.S. with GDP deflator above growth.

At current exchange rates, the OECD block accounts for about two-thirds of the global economy and the emerging economies, one-third. This fact suggests that the global economy will grow at 2% with inflation at 3%.

Global policy paralysis The latest IMF, World Bank and G-20 meetings didn’t come out with new ideas. The same people were talking about the same policy prescriptions. Despite the massive stimulus by any measurement so far, the global economy remains stuck. The excuse is that the stimulus should be bigger.

I predicted the 2008 Global Financial Crisis on the debt binge in the West to defend its living standard during a prolonged period of declining competitiveness. After the crisis occurred, I predicted that the global economy was heading toward stagflation, as the policy makers around the world would embrace stimulus, the wrong medicine for what ails the world.

The bubble bursting was supposed to be a wake-up call. But it was interpreted as a cyclical event, like a natural disaster, or just bad financial decisions.

In the Anglo-Saxon world, the main response was stimulus to jump-start the economy, believing that the economy was like a car running out of battery power. In the euro zone, the main response was to control debt growth, the so-called austerity. Neither has worked. However, the policy debate remains stuck as stimulus versus austerity.

Technology and globalization have made jobs and production of goods and even services mobile. But people are still confined within national boundaries. Global competition largely determines one’s income. But many expenses like housing, healthcare and education are locally determined. The asymmetry is wreaking havoc for a large share of the population in the developed economies. The second and equally-important mismatch is in local market flexibility versus global competition.

The labor market isn’t as flexible as markets for goods or services under the best circumstances. Hence, the unemployment rate is higher than that for other factors of production. To protect labor, the OECD economies have built up or tolerated many practices to limit businesses from adjusting labor demand in response to demand fluctuations in goods and services.

Such well-intentioned market impediments are running into the brick wall of globalization. A business doesn’t need to make things where it sells. Apple is the best example in that regard. So countries have lost control over businesses.

The two mismatches must be solved together. Higher living costs justify labor protection. Unless the big ticket items in living costs reflect global competition, the wages that result from global competition aren’t living wages. Hence, governments should focus on decreasing living costs and increasing supply side flexibility.

Yes, gold doesn’t bear interest. Many, including Warren Buffett, belittle its investment value. But, paintings or antiques don’t bear interest either. When money supply is rising, anything scarce tends to rise in value. Gold is the best scarce commodity in the world.

Monetary stimulus magnifies the problem. It inflates non-tradables like healthcare, education and housing, increasing resistance to labor market flexibility. In that regard, the stimulus and austerity approach is still the same. The later doesn’t solve the growth problem, pushing the central bank into monetary easing.

Everyone for themselves Crisis tends to produce strong leaders, as demonstrated by World War II and 1970s’ stagflation. The 2008 crisis didn’t. It may take another crisis to elevate a generation of leaders with the right medicine for nation states to fit into the world of globalization. Until then, people must survive stagflation as best they can.

The real interest rate is probably minus 2% in the world today. It should be in line with the per capita income growth rate or 1%. The difference is 3%.

This environment redistributes wealth from savers to debtors on a scale of over $2 trillion per annum or $55 billion per day. This must be the biggest legal robbery ever in human history. But it is always coded in arcane academic lingos spoken by respected central bankers with impeccable CVs. All that is just packaging; it is robbery nevertheless.

The fifth column The world is composed of sovereign nation states. Today’s multinational corporations (MNCs) are really the fifth column of instability. The IT revolution has spawned today’s MNCs. They can shift production and sales to anywhere with low costs. They can locate their staff anywhere for doing any job.

As commercial organizations, they can of course arbitrage differences across nation states for profits. As nation states have evolved independently, the differences among them are big. Hence, the profit opportunities for MNCs are abundant. When the global crisis hit, the affected countries adopted different policy responses, creating more profit opportunities for MNCs. Despite sluggish global growth the MNCs have reported strong profit growth since the crisis.

Globalization has made most markets global. This increases the stake of winning but also its hurdles. This is why there are virtually no new global companies in the past decade. This factor makes the existing MNCs more valuable. I believe that pension funds should invest most of their money into MNCs.

Not all the MNCs are the same. Big isn’t necessarily a guarantee for success. One must have something difficult to duplicate. Brands are the best asset in the world today. Food brands, in particular, are well positioned to profit from income growth in emerging economies. Luxury brands, despite their recent setbacks, are also well positioned.

Technology isn’t a good long term investment in general. In the information technology world, sooner or later, someone will come up with something better. In mature industries, however, some technologies are hard to duplicate. Energy, chemical and machinery are better bets.

Financial markets believe that corporate credit shouldn’t surpass sovereign debt. Such thinking no longer applies in today’s world. A balanced MNC has revenue evenly spread across the world. Its income volatility is less than a country’s tax revenue. MNCs have lower leverage and higher income growth than nation states. I believe that, if one invests in bonds, MNCs are better than government bonds.

A speculator’s paradise Whenever growth rate disappoints, demanding more monetary stimulus is always the outcry. A central bank will predictably release dovish statements to satisfy the market. Even though the monetary stimulus, even when it works, takes a long time to kick in, it affects asset markets right away.

When countries adopt the same policy — but at a different times — global speculators are presented with fantastic opportunities in all liquidity assets. Economics isn’t good at studying speculation. It assumes it’s not important. But the speculative capital, when fully leveraged, is probably half of the global GDP.

It can magnify volatility to such an extent that mass panic results, changing the equilibrium path for a country of even the world. To some extent, macro policy making is held hostage by global speculative capital.

When you can’t beat them, join them. It may not be moral, but quite profitable to join the global speculative capital. One can invest in some of the funds or mimic their trading patterns. Monetary policy essentially redistributes wealth from clueless savers to debtors and speculators. You can fight back by joining the dark side.

Gold still glitters The recent sharp decline in gold prices has shaken the confidence of many people. Don’t worry. The price of gold has dipped, but will rise to new heights soon. In the long term, gold prices will rise far more than inflation. For the masses, gold is the best inflation hedge. It is the best weapon for the little guy to fight central banks that help a few to rob many.

Yes, gold doesn’t bear interest. Many, including Warren Buffett, belittle its investment value. But, paintings or antiques don’t bear interest either. When money supply is rising, anything scarce tends to rise in value. Gold is the best scarce commodity in the world.

There are more artists that can paint more paintings every day. 80% of the world’s gold has already been extracted. The remaining 20% will be dug up in the next 20 years. The money supply will grow forever. But the gold supply can grow only by 25% and no more.

The income growth in emerging economies will vastly increase with gold demand. When people realize how little gold the world has left, the price will skyrocket. If you don’t know how to preserve your wealth in an inflationary environment, you should accumulate gold. When the price comes down, just as it did two weeks ago, just buy more.
0 Comments

Natural Resources - LNG

5/7/2013

0 Comments

 
Picture

What Is LNG Anyway?
LNG Exports Benefit Russia

COMMODITIES CORNER


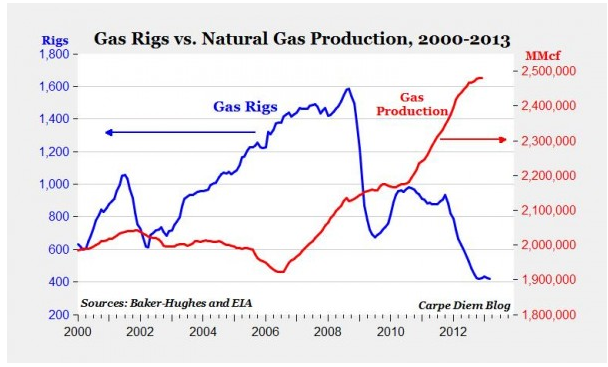
Natural resources particularly liquid natural gas (LNG) is definitely in a boom state. With industrial usage up 20%, record production increases of 17% and new fracking technologies, LNG is poised to generate healthy gains over time starting this year. I first noticed that the LNG transport providers were making huge gains. If the providers have an increase in revenues then surely the demand for LNG must be increasing as well. Last summer while some providers were still affordable, we took a position in several and hedged it with both puts and calls. I must say aside from the momentary gains before the April correction, those options really kept us afloat during the storm.

Picture
ALL NEW BENCHMARKS ARE ON THE HORIZON

Natural gas prices in the U.S. Northeast are poised to reach five-year seasonal highs this summer because increasing demand from power plants may be too much for pipelines to handle.

Kinder Morgan Energy Partners LP (KMP), Spectra Energy Corp. (SE) and Williams Cos., which own the region’s main interstate pipelines, say their systems are running at or near capacity. New England electricity customers were on the verge of rolling blackouts last June and again in February amid equipment failures and limited gas supply during periods of high demand, according to Philip Moeller, a member of the Federal Energy Regulatory Commission.

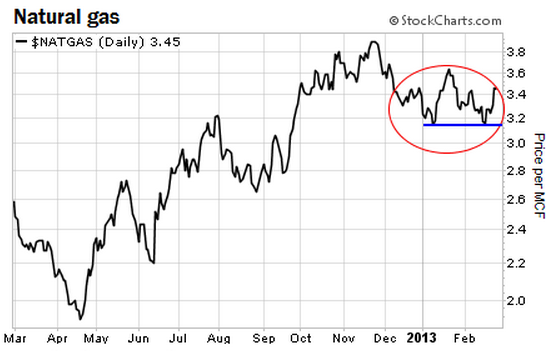
Natural gas now has a double bottom in place just below $3.20 (the blue line). That will provide support on the downside. The chart is also tracing out a potentially bullish "W" pattern (the red circle). This is an intermediate-term bottoming formation... and it could lead to a strong rally if natural gas can break out above $3.60. Seasonal trends are also starting to shift in favor of higher prices. Natural gas tends to reach at least a short-term bottom in the spring. Then it rallies into the early part of summer where it often peaks for the year and provides a better short-selling opportunity.


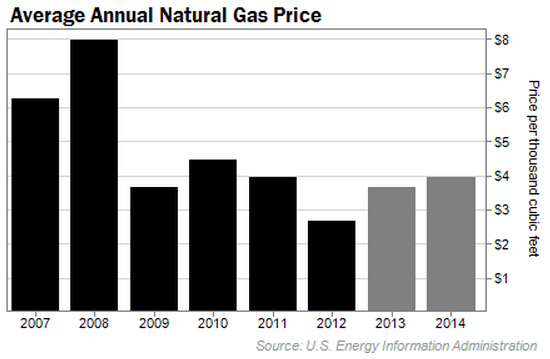
But for now, we're entering the time of year when natural gas prices often bottom. We no longer have the tremendous glut of natural gas we had back in November. In its most recent inventory report, the U.S. Energy Information Administration reported that natural gas inventories had dropped to 2.4 trillion cubic feet. That's slightly above the normal storage amount for this time of year... But it's 30% less than what was in storage in November. And it's down 9% from the same time last year. Lack of adequate infrastructure to meet consumer and regulatory demands will only result in premiums to surge to an all new benchmark toward the end of the year.

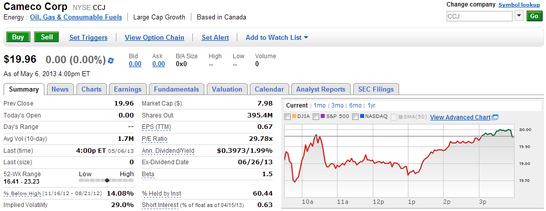
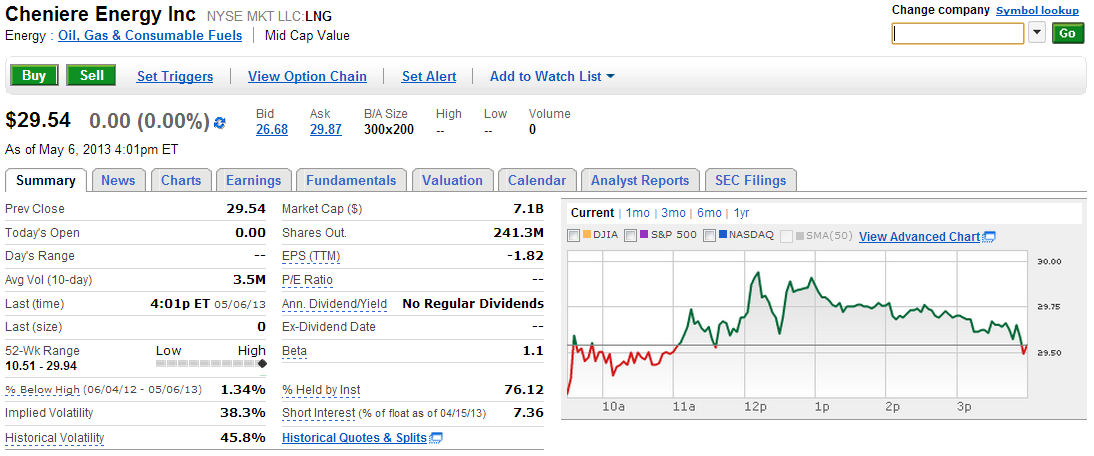
I recommend the following companies below to take a position in. Since March, we have had
an average 83% gain combined with both equities and options. By the time winter rolls around, we all should finish the end of the year out with a warm and cozy feeling...Ahhhh!

Hedge Well!

Picture

Picture

Picture

By Matt Badiali, editor, S&A Resource Report 
Wednesday, May 1, 2013

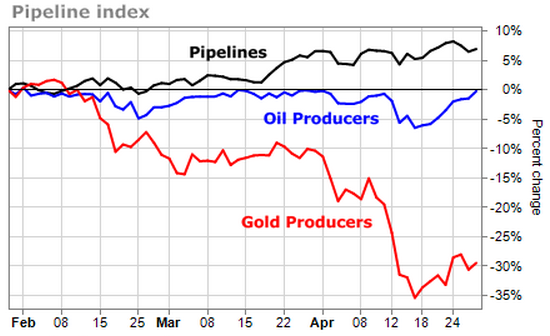
The whole commodity sector just got punched in the gut... Over the last three months, palladium is down 7%, platinum is down 11%, gold is down 12%, copper is down 15%, nickel is down 15%, and silver is down a huge 25%. As regular readers know, commodity producers are leveraged to their commodity prices. As a group, base-metal producers are down around 15%. Gold producers are down 29%. And silver producers are down 29%. What's still standing? I'll show you today... Take a look at the chart below. It's the benchmark pipeline index ($AMZ) plotted against the big oil producer fund ($XOI) and the big gold producer fund ($HUI). Gold producers got crushed, as you know. Oil producers are about breakeven. And pipelines sailed through the trouble. As a group, they're UP more than 5% in the last three months. 
Picture
While precious and base metals were getting destroyed, oil only dropped 5%... and natural gas was up more than 30%. That helped energy producers sidestep the sell off. It also helped the pipelines hold steady... That and a couple other attractive qualities: income and growth.  Pipeline companies own the huge transportation network that moves oil and gas around the country. Thanks to the shale revolution, we're tapping huge new supplies of oil and gas. And this pipeline network is seeing huge growth. Since 2008, the industry has seen $50 billion in investment on 11,000 miles of new pipelines. (And those are just the giant main lines. That doesn't include the web of pipes that gather the oil and gas in the fields.) All these new pipes are creating a boom in pipeline company revenues. And since many pipelines are structured to pay out income, growing revenues have translated into growing payouts.
Picture
As you can see, each of these companies grew dividends by triple digits over the last five years.  As my Stansberry & Associates colleagues have pointed out many times, income is the "fashionable trade" these day. And pipelines' high yields have attracted loads of new money. The pipeline index is up 20% since late December, nearly double the broad market's run. So these stocks aren't as cheap as they were last year... Except for TransCanada, they're all yielding less than their five-year average yields. And they have an average EV/EBITDA of 16.8. The five-year average is around 11. (Enterprise value, or EV, takes into account the company's market value, debt, and cash. EBITDA is earnings before interest, taxes, depreciation, and amortization) Once you take growth into account though, these stocks are still near sensible prices. Using forward earnings estimates, here's how they stack up, from most expensive to least...
Picture
While next year's numbers might not pan out exactly like analysts predict, growth IS coming. According to the Energy Information Administration, almost 2,000 miles of new pipelines that can carry 26 billion cubic feet of natural gas per day will be added by 2017. Kinder Morgan Energy Partners and TransCanada already have major new pipelines under construction.  These companies' shares fluctuate with the oil price. And they're more volatile than your standard "safe haven" income-payers. Williams Partners, for example, dropped nearly 30% last year. But most of its peers have held up well over the last few years... and they all held up very well during the recent sell off. They're protected because they get most of their revenue from "tolls" rather than selling oil or natural gas. And in a zero-percent world, investors are desperate for the kind of income they pay. After their big run up, pipelines might be due for a breather. But the trends driving them higher are set to be in place for years to come.

Picture

Picture
0 Comments

And They Say Gold is Dead…Bah! Humbug!

5/6/2013

1 Comment

 
Picture
COMMODITIES CORNER

The recent 15% drop in gold allegedly was due to the Japanese Market selling short in order to meet huge margin calls. I can buy that a tremendous volume shift could tank a global price point but we experienced the biggest crash in 30 years within a two day period!
This sounds like a complete market manipulation by some seriously deep pocketed characters. What better way to continue to corner the market by making the acquisitions more affordable.

Well everyone has heard by now that Gold is over-bought, gold stocks are in the toilet and may even drop further, etc. The price of the commodity was grossly inflated in my opinion especially compared to platinum and other precious metals but the reality remains that it highly valued and sought after. As long as they keep mining it, somebody will keep buying it. I don’t see luxury jewelers Like Tiffany’s cutting back on selling gold jewelry. Tiffany’s has been expanding in various regions even in this economy.

That just proves my point that those who can afford certain luxury items will buy them regardless of the market conditions or price. With that being said, I concur with a lot of the experts and analysts out there that are encouraging us to stay clear of gold stocks. The words “gold stocks” typically refer to gold mining stocks. Let me be clear on this…I never liked them, nor do I like gold ETFs. I do however like gold royalty stocks. What is the difference you ask?

Gold royalty companies provide money to gold mining operations in exchange for a portion of revenues (the royalty) for some multi-annual duration. I have seen some companies have a 99 year royalty agreement in exchange for $2 million in operating capital. That’s not a bad deal for the royalty company if the mining operations hit a huge deposit.

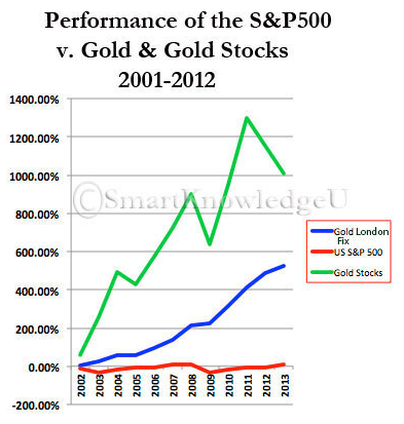
Gold royalty companies have outperformed the actual bullion especially towards the latter of the third quarter last year, ironically right before gold started to drop. Certain gold royalty companies finished out the year with over 450% returns. The insane price of gold ($1700+ oz.) at that time of course affected the dividend payment. By compounding or reinvesting the dividends over the duration of ownership of these types of stocks, you would finish out the year with a bottle of Dom Perignon. Now that’s my kind of investment and it is for that very reason I am very bullish on gold royalty companies while they are seriously undervalued and at bargain basement prices.

I positioned both my own and our clients’ portfolios with a hedged strategy that included both equity stakes and options on gold royalty companies. We took a beating on April 15th thru the 19th due to that incredible market decline. Precious metals took an exceptional beating. From copper to platinum, everything metallic or that looked metallic tanked. We saw months of profits go right out the window in a matter of days. We finished out the week taking possession of all those option positions.

Most people would be ready to jump out the nearest window but not us. Yeah, we took a beating but we ended up owning a lot more of what we like to own anyway and at a hefty discount. Yeah, we are in a hold pattern for a while on all our precious metals but that gives us more time to enjoy those compounded dividends and really cash out when it’s time to close the positions.


In the interim, if you have the means buy...buy...buy silver and gold royalty stocks NOW!!! Analysts are saying that they haven't bottom yet. So what, keep buying because within a four year period I anticipate a 400% gain and that's being very conservative.

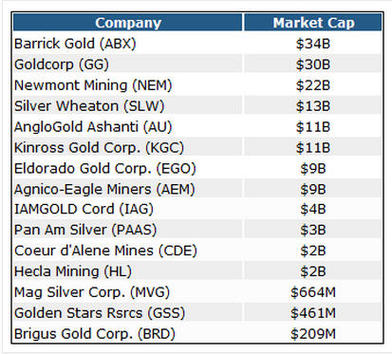
           GOLD / SILVER COMPANIES MARKET CAP
Picture
Picture

I am definitely in a hold it and forget it  for the next four years pattern on some of these and a few others.

I recommend an equity position in any of these coupled with some naked puts and covered calls to not only hedge the equities and generate income but to boost the overall ROI.

Do your research on which companies offer the highest dividends with a consistent annual dividend growth rate.


Forbes On How Fed Fueled Gold Crash

1 Comment

    RSS Feed

    Archives

    December 2014
    February 2014
    November 2013
    October 2013
    September 2013
    August 2013
    July 2013
    June 2013
    May 2013

Powered by Create your own unique website with customizable templates.