The Millionaire Maker Investment Advisory
  • Introduction
  • Market Conditions
  • Commodities Corner
  • Featured Interview
  • Understanding Markets
  • Understanding Money
  • Understanding Value
  • The Tax Shelter
  • Retire Rich
  • Radio Blog
  • Contact

How to Invest in the Next Major Oil Field

6/28/2013

0 Comments

 
Picture
COMMODITIES CORNER

There is a lot of talk about shale repositories and fracture drilling which could be a tremendous boom to the US energy sector.  Hedge these investments with transportation and equipment suppliers to the sector not to mention some liquid natural gas suppliers.

By Frank Curzio

The Cline Shale is a lot busier than it was six months ago.  I just returned from visiting the area with my friend Cactus Schroeder. Cactus is one of the smartest men you'll find in the oil business.  He's been drilling for oil in Texas for more than 30 years... with personal interests in over 1,000 drilling projects.   Right now, Cactus is drilling like crazy in the Cline.


He believes it's "one of the greatest shale areas this country has ever seen."  That's a bold statement from someone who lived in North Dakota – home to the massive Bakken Shale.  He's also drilled wells in the Eagle Ford, another massive shale regions in southern Texas.  The good news for investors is this area is still well under Wall Street's radar. But I don't expect it to stay that way for long.

The Cline Shale is located in western Texas. It lies roughly 9,000 feet below the surface in an area known as the Permian Basin (shaded below). It runs about 140 miles long and 70 miles wide.
Picture
The Cline is in its early stages of development.  But Special Core Analysis Labs, a reputable 24-year-old core oil-and-gas analysis firm in Texas, predicts there are 3 million barrels of oil per square mile located in the Cline. Based on the region's roughly 10,000 square miles, it could amount to a massive 30 billion barrels of oil.

At current demand, that's enough oil to supply the entire U.S. for more than four years.   By comparison, the Eagle Ford has an estimated 26 billion barrels. And the Bakken Shale has roughly 13 billion barrels, according to oil-and-gas giant Pioneer Natural Resources.  This was my second visit to the Cline. On my last visit in October, most of the towns in the region had populations of less than 1,000 people. The roads were empty. Cactus and I would drive for 50 miles without seeing a single person.  

Today – just eight months later – the scene has changed.   There are now several independent companies with water pits along route 180, a major highway that runs through the Cline. (Fracking a well requires millions of gallons of water – laced with sand and chemicals – shot underground to blast apart rock and retrieve oil or gas. 

This water is stored in open pits located near drill sites.) I also noticed dozens of billboards with ads for oil-and-gas services.   Cities like Abilene and Midland (located just outside the Cline) are becoming crowded. Cactus tells me oil-services workers are buying apartments in these areas and commuting over an hour to work.  And industry insiders believe oil services giant Weatherford International is opening a huge plant in Abilene.  

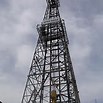
As we drove through these counties, we saw a lot more drilling rigs. Keep in mind, most of western Texas is desolate. The 100- to 200-foot-tall drilling rigs look like skyscrapers in the middle of a desert. And Cactus tells me this is just the beginning.  You see, the Cline is still in its early stages of development.  It's not even close to what we are seeing in the Eagle Ford and Bakken in terms of the number of new homes being built.

The towns that sit on top of these shales have Wal-Marts and crowded restaurants.  That means business is just starting to boom in the Cline Shale region... investors can still make money as the number of major oil and gas finds in the area continues to grow.   The major players in the Cline Shale include giants Pioneer Natural Resources (PXD) and Devon Energy (DVN). Pioneer holds over 900,000 acres and Devon holds over 600,000.  Both stocks have market caps around $20 billion.

However, I like Devon better than Pioneer today.  The stock is trading at just 10 times forward earnings and near its 52-week low after disappointing investors last quarter.  That means expectations are low. Plus, Devon is committed to drilling at least 30 new wells in the Cline this year. 

Other players include oil and gas producers Apache (APA) and Range Resources (RRC). Kinder Morgan Energy Partners (KMP) is a great infrastructure play. The company is planning to build pipelines throughout the region.  These three names have much less exposure to the Cline than Devon and Pioneer. But they will see huge profits if the Cline turns out to be as big as Cactus predicts.
0 Comments

THE VOLATILE, BUT SIDEWAYS, MARKET IN COMMODITIES

6/16/2013

0 Comments

 
Picture
COMMODITIES CORNER


This week, we've shown you the rising trends in consumer and government spending. Stocks that track these two sectors are soaring. One market that isn't soaring, despite some claims to the contrary, is the commodity complex.

If you watch the financial media for a week, you'll likely hear someone say commodity prices are rising due to the debasement of the U.S. dollar. While this is a serious future concern, it actually hasn't hit the market. For proof, we consult the "CRB Index".

The CRB is one of the most widely used gauges of commodity prices. It tracks the price of basic raw materials, like copper, oil, corn, natural gas, gold, sugar, cotton, and nickel.  Below is an eight-year chart of the CRB. In 2005, the CRB sat around 300. Since then, it has "boomed" and "busted" several times. All this volatility has produced no price gains, however. As of this week's trading, the CRB sits around 285. It's been a long, sideways market in commodities.
Picture
0 Comments

Gold Stocks Are about To Run Higher

6/4/2013

0 Comments

 
Picture
COMMODITIES CORNER

We suspected it a couple weeks ago when we bought into Kinross Gold (KGC). We became more confident of it last week when we tried to get into Hecla Mining (HL) and Eldorado Gold (EGO). Now, with the continued strength in the Market Vectors Gold Miners Fund (GDX), I'm convinced gold stocks have started a new uptrend – one that should last for several months.

It won't be a straight shot and there will be plenty of bumps along the way. Many of those bumps will be severe enough to shake folks out of their positions and keep the depressing memories of the past six months alive. However, I do believe gold stocks have started a new uptrend. Traders should now take advantage of any weakness in the sector to add exposure. Take a look at this chart of the Market Vectors Gold Miners Fund plotted against several moving averages.
Picture
Traders use moving average lines to help spot short-term support and resistance levels and to determine the overall trend of a move. Two of the most popular measures are the 50- and 200-day moving averages (DMAs). I like to use the nine- and 20-day exponential moving averages (EMAs) as well.

As you can see from the chart, the nine- and 20-day EMAs provided solid resistance for GDX since the stock dropped below these averages last November. For the past six months, each time GDX attempted to rally, it hit the nine- or 20-day EMA and turned back. You can see that last week, GDX rallied above both its 9 and 20-day EMAs. That signals a new uptrend is in place and the averages should now serve as support for any pullbacks in the stock.

The next resistance level is the 50-DMA, which is at about $31 and declining. GDX should be able to overcome that resistance level this week or next. Once that happens, GDX should work its way higher toward the 200-DMA near $42. So even though GDX has rallied more than 10% off the bottom it hit two weeks ago, there's still plenty of room for it to run higher. And there are plenty of opportunities to profit in the mining sector.

The trade setup I like best is Allied Nevada Gold Corp. (NYSE MKT: ANV).

ANV is a former high-flying gold stock. But it has become one of the worst-performing mining stocks in 2013. The stock started the year above $30 per share. It's now trading below $8. That's a 73% loss in a sector that's down 33%. The problem with ANV has more to do with "hype" than with anything fundamentally wrong with the company. At the highs in the stock, investor expectations were overly optimistic. Today, we've reached the opposite extreme. And that's what makes ANV such a tremendous opportunity. Let me explain...

Allied Nevada operates the Hycroft mine in Nevada. With over 20 million ounces of gold and nearly 700 million ounces of silver, Hycroft is one of the largest resource deposits in North America. But prior to 2007, virtually nobody even knew about it. The Hycroft mine was previously owned by Vista Gold (VGZ). In 2006, VGZ decided to spin off the Hycroft mine and several other Nevada properties to shareholders in the form of a new company – Allied Nevada. This spin-off gave investors a chance to evaluate the Hycroft mine resources separately from Vista's other properties, and that's when the boom began.

Since 2007, Hycroft's gold reserves have increased 1,200%. And its silver reserves have increased by more than 500 million ounces. By 2011, ANV was sitting on $25 billion worth of gold and silver. Investors took notice, and the stock rallied from $5 per share in 2006 to over $45 per share at its peak in 2011. Like many gold stocks in 2011, though, the price was ahead of the fundamentals. The company still had to get the gold and silver out of the ground. As the cost of mining the precious metals increased, profit margins decreased and the stock prices came tumbling down.

Today, ANV is a tremendous bargain. At less than $8 per share, the stock trades at just four times this year's expected earnings. The company has more than $25 billion worth of proven and probable resources. Yet the entire market capitalization of ANV is just $700 million. In other words, buying ANV right here below $8 per share is like buying gold at less than $40 per ounce. Seabridge Gold (SA) is the only gold stock that is cheaper than ANV relative to the value of its resources. But Seabridge doesn't operate any mines yet. The Hycroft mine is currently operating. Production is expected to increase 40% this year and triple by 2015.

Shares of ANV fell hard last month when the company priced a secondary offering of stock at $10.75 per share. The company raised $150 million to fund expansion plans at the Hycroft mine. Today, the stock is 30% cheaper. Think about that for a moment. Today, we can buy the stock 30% below where a secondary offering was priced just three weeks ago. We can buy the stock at less than four times 2013 earnings estimates and at a fraction of the value of ANV's resources. The chart below shows the stock is just starting to develop a bullish pattern. 
Picture
ANV bottomed out along with the rest of the gold sector three weeks ago. The stock has since formed a higher low and closed yesterday above the resistance of its nine-day EMA. If it can get above $8 per share, the next resistance is the 50-DMA up around $11.

Ultimately, though, I expect ANV could easily double from here and challenge its April high of $15 per share. Even at that price, the stock will still only be trading at eight times this year's earnings estimates. It would still be like buying gold for less than $80 per ounce. This is a cheap stock. It's unloved. And it has enormous upside potential. Here's the option trade I like best:

Buy the Allied Nevada December $7.50 calls (ANV131221C00007500) up to $2.25.

These options closed yesterday at $1.80 when ANV closed at $7.90. You should be able to get into this trade as long as ANV is trading below $8.30 by the time you enter your order. Don't chase this trade higher. We're already giving it plenty of room. If the options run up as a result of this recommendation, give the trade a few days to come back down into range. This is a speculative position. So don't overleverage the trade, and don't put up more money than you can comfortably afford to lose. As much as I like this setup in the gold sector and in ANV, you can still lose 100% of the funds you commit to this trade.

ANV has lots of options available to trade. So if the ANV December $7.50 call options move out of range, consider an alternative strike price or a different expiration month. For example, the ANV December $10 call options look like a good purchase up to $1.25. And the ANV September $7.50 calls look good up to $1.80. This trade has tremendous upside potential. If ANV can merely rally back up to where it started April – at about $15 per share – the ANV December $7.50 call options will be worth at least $7.50. That's a 329% gain over yesterday's closing price, or a 223% gain on the maximum recommended purchase price.

Let's set a closing stop on this position at $1. In other words, if the ANV December $7.50 calls close at $1 or below, sell the position the next trading day. On the upside, be sure to sell at least half the position once you've made 100% on the trade, if we're fortunate enough to get there.

Eldorado Gold (EGO) got away from us and we weren't able to take the appropriate position.  Keep an I on it. I suspect we'll have a little hiccup between now and next week which may drop the stop around $7.50 or below. When that happens jump on-board the gravy train and hedge the option chain with both a call and put.


Hecla Mining (HL) reached our first target price last week.
Picture
The stock pulled back a bit and now looks ready to make another run higher. A move up toward the $4.30 resistance line should be enough to double the value of the HL December $3.50 calls.

If you were able to get into this trade, look to take profits on the next move higher. If you weren't able to get into this trade, forget about it for now. HL has already made a solid move off the bottom, and traders should now be looking for an exit. Today's ANV recommendation has a better risk/reward setup. And there will be even more to choose from as the gold-stock uptrend develops.

We sold half our Kinross Gold November $5 calls for a 100% gain yesterday. Here's an updated look at the chart.
Picture
Resistance at $7.20 still looks like a good short-term upside target. We'll continue to hold the balance of the trade with a stop at $1.35.

The broad stock market looks like it's preparing to make a strong turn to the downside. But Friday's selling pressure pushed a few of the short-term technical indicators I follow into "oversold" territory. So I'm expecting stocks to bounce a bit and relieve the oversold conditions before I recommend any more trades from the short side. Yesterday's bounce was a good start. But we probably need to work a bit higher still.

Aggressive Trades
  • Silver Standard Resources June $10 calls (SSRI130622C00010000)
  • Eldorado Gold July $10 calls (EGO130720C00010000)
  • Seabridge Gold January 2014 $13 calls (SA140118C00013000)
  • Hecla Mining December $3.50 calls (HL131221C00003500)
  • Eldorado Gold October $7 calls (EGO131019C00007000)
  • Allied Nevada December $7.50 calls (ANV131221C00007500)
Longer-Term Positions
  • Pacific Rim Mining (TSX: PMU)
  • GigaMedia (Nasdaq: GIGM)
  • Barrick Gold (NYSE: ABX)
0 Comments

Platinum and Palladium: A Fundamental Shift

6/2/2013

0 Comments

 
Picture
COMMODITIES CORNER

Platinum is a precious metal, as is palladium, though to a lesser degree. However, like silver, both are also industrial metals. Unlike silver, it's their industrial use that is the primary price driver for both platinum and palladium – and that use is undergoing a fundamental shift.

By Jeff Clark

The largest source of demand for platinum and palladium is the automotive industry, for use in autocatalysts. In turn, the fortunes of the auto industry are sensitive to the health of the world's major economies. We've been bearish on platinum-group metals for years, primarily because we weren't convinced a healthy – much less roaring – world economy could be sustained when so many governments continue spending beyond their means.

We reconsidered the market last year, when strikes in South Africa – home to 75% of global platinum production and 95% of known reserves – threatened supplies. But as we wrote last December, the strikes ended without great impact on long-term supply. Since then, however, the fundamentals of this market have changed. Others may disagree with our economic outlook, which is still bearish, but it's due to supply issues – not demand – that our interest is now drawn to these metals, and particularly to palladium.

Here's a look at global supply against auto-industry demand for both metals.
Picture
Approximately 55% of platinum and the bulk of palladium supply was used in catalytic systems last year. The shrinking supply that's under way with both metals is obvious, and palladium is approaching a supply/demand crunch.

Here's what's going on…

Platinum The fall in platinum supply has been so great that it moved from a surplus in 2011 to a deficit in 2012, with Johnson Matthey estimating that deficit to hit 400,000 ounces, the highest level since 2003.

Why the shift?

  • Labor strife and power outages. The mining industry in South Africa is, frankly, a mess. Labor strikes continue to haunt the platinum mining companies. The largest mining union in South Africa, AMCU, recently refused to sign a collective bargaining agreement on worker compensation, and CNBC is predicting a massive strike. Amplats, the world's largest platinum producer, is threatening to cut 14,000 jobs and mothball two operating mines due to various issues. Meanwhile, power outages, a longstanding problem, continue unresolved; they have already forced the closure of some mines and are widely expected to cause further cuts in production. As a result, supply from mining is expected to decline another 10% this year.
  • Recycling. This important source of supply is falling in reaction to lower metals prices. It is estimated that recycling fell by 11% in 2012.
  • Emission systems. Demand for platinum in autocatalysts dropped by 1% in 2012, mostly due to lower vehicle production in Europe and lower market share of diesel engines. However, emission-system demand from Japan and India is expected to increase, and diesel-emission controls recently introduced in Beijing will also support industrial demand for both metals. Auto sales in China rose a whopping 19.5% in the first two months of the year and are 6.5% higher in the US than a year ago.
  • Jewelry. Worldwide demand for platinum jewelry rose last year, with strong demand coming from China and growth in India, and is mainly the consequence of lower prices. Jewelry accounts for 30% of total platinum demand.
  • Investment. Although it represents just 6% of total demand for the metal, investor demand nonetheless grew 6.5% last year, adding to pressure on supplies.
Given these factors – primarily the first one – a supply deficit stretching into 2014 seems almost certain. Until South Africa can resolve its labor and power issues, pressure on platinum supply will remain, producing a favorable environment for rising prices.

Palladium Palladium, platinum's "little brother," also faces a market imbalance. In 2012, the deficit totaled 915,000 ounces, the highest level since 2001.

  • Supply. Russia is the second-largest producer of palladium, and some analysts report that rumors of its stockpile being close to depletion are true. Recycling is also falling, and production disruptions in South Africa – the largest producer of palladium – are the same as outlined for platinum. Overall supply of the metal is falling.
  • Demand. Autocatalytic demand rose by 7% in 2012, as palladium can be easily substituted for platinum in emission-control systems for gas-powered motors (but not diesel-powered ones), such as are favored in China and India. In fact, several experts we consulted were more bullish on palladium than platinum due to this "substitution factor" – and China just mandated catalytic systems for all cars in the country.

Palladium investment demand was positive last year, though palladium jewelry has yet to gain traction in China, one of the world's biggest jewelry markets. Total jewelry demand for palladium was 11% lower in 2012. However, we expect a greater shift to palladium in the expanding Asian automotive market, which in turn will boost palladium prices.

The fundamental drivers of the palladium market are similar to those for platinum, which makes the palladium market an equally attractive investment. If this all weren't bad enough, most companies' production costs are now above current platinum and palladium prices. This can only be solved one way: higher metals prices.

Bottom Line The supply disruptions in South Africa combined with secondary factors have led to deficits in both metals that won't be erased overnight. Such imbalances, together with mainstream expectations of global economic growth, create a favorable environment for PGM price appreciation.

This much seems like a safe bet. There is, however, a great deal of speculative upside in the not-inconceivable case of South Africa going off the rails in a major way. Massive – not marginal – supply disruptions in the world's main source of both metals would send their prices through the roof. You get this speculative potential "for free" when you bet on the more conservative projections that call for rising prices regardless.

While we wait for our gold positions to rebound, an investment in platinum and palladium could be very profitable. The longer-term outlook remains in place: most G7 economies are not fundamentally sound and continue to print money. Gold is still our priority asset class, so we don't recommend that investors replace their gold holdings with platinum and palladium investment vehicles. This PGM trend is simply an addition to the diversification of your current investment strategy.
0 Comments

    RSS Feed

    Archives

    December 2014
    February 2014
    November 2013
    October 2013
    September 2013
    August 2013
    July 2013
    June 2013
    May 2013

Powered by Create your own unique website with customizable templates.