 | MARKET CONDITIONS PROFILED: SodaStream International (NASDAQ: SODA) |
Home beverage carbonation systems manufacturer SodaStream International (NASDAQ: SODA) had a great run from November 2012 into its early June 2013 highs.
Since then, however, the stock has traded in a much less orderly fashion, and this week, it finally fell out of a bull flag formation, snapping several important moving averages and trendlines. As a result, the stock now looks to have further downside ahead.
The business of selling water carbonation systems isn’t what many would consider “sexy.” Yet, SODA reacts well to technical analysis and has just the right amount of volatility and plenty of volume to satisfy traders.
The company went public in November 2010, and its relatively recent arrival on stage may be part of the reason it’s gotten so much attention from the trading community.
But with the stock breaking key near-term support levels and the next major distraction (its Nov. 4 earnings announcement) not scheduled for another three-plus weeks, traders looking to play some near-term downside have plenty of time to do so.
Since it began trading, SODA has seen plenty of swings with the occasional up/down gap after major news announcements. But through a technical lens, the stock has acted in a fairly orderly manner.
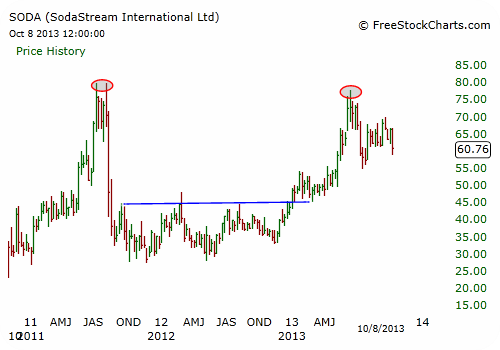
Unlike some of the new social media offerings, SODA started off its career as a publicly traded company with a bang. From its debut in November 2010 to its double-top in July/August 2011, the stock rose roughly 300% with constant bidding pressure under the stock.
Like many IPOs though, too much of a good thing gets punished as rookie stocks go through growing pains. The summer 2011 double-top eventually led to the stock wiping out almost the entire honeymoon rally in just two months, finding a bottom in October 2011.
SODA then spent the next 13 months or so in a much more humble trading range, which did however establish a series of marginally higher lows versus the October 2011 bottom.
This “good” behavior was eventually rewarded with a beauty of a breakout past a 15-month resistance line in January of this year. From there, the stock rallied strongly into a June top, which could be looked at as a retest of the summer 2011 highs.
Since then, however, the stock has traded in a much less orderly fashion, and this week, it finally fell out of a bull flag formation, snapping several important moving averages and trendlines. As a result, the stock now looks to have further downside ahead.
The business of selling water carbonation systems isn’t what many would consider “sexy.” Yet, SODA reacts well to technical analysis and has just the right amount of volatility and plenty of volume to satisfy traders.
The company went public in November 2010, and its relatively recent arrival on stage may be part of the reason it’s gotten so much attention from the trading community.
But with the stock breaking key near-term support levels and the next major distraction (its Nov. 4 earnings announcement) not scheduled for another three-plus weeks, traders looking to play some near-term downside have plenty of time to do so.
Since it began trading, SODA has seen plenty of swings with the occasional up/down gap after major news announcements. But through a technical lens, the stock has acted in a fairly orderly manner.
Unlike some of the new social media offerings, SODA started off its career as a publicly traded company with a bang. From its debut in November 2010 to its double-top in July/August 2011, the stock rose roughly 300% with constant bidding pressure under the stock.
Like many IPOs though, too much of a good thing gets punished as rookie stocks go through growing pains. The summer 2011 double-top eventually led to the stock wiping out almost the entire honeymoon rally in just two months, finding a bottom in October 2011.
SODA then spent the next 13 months or so in a much more humble trading range, which did however establish a series of marginally higher lows versus the October 2011 bottom.
This “good” behavior was eventually rewarded with a beauty of a breakout past a 15-month resistance line in January of this year. From there, the stock rallied strongly into a June top, which could be looked at as a retest of the summer 2011 highs.
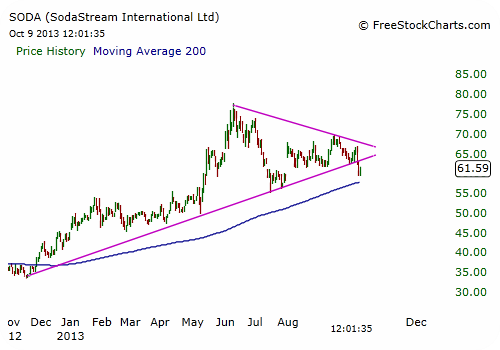
Moving on to the daily chart below, the recent technical damage is clearly visible. On Monday, SODA sliced through its 50-day and 100-day moving averages (not shown on chart), as well as its November 2012 uptrend line.
The selling continued Tuesday, thus confirming this weakness is unlikely to halt right away. SODA gave traders plenty of warning that a wait-and-see approach heading into October was warranted. After topping in early June, the stock began to develop a wedge pattern and a lower high in mid-September, after which it continued to reject the June-to-September resistance line.
Finally, with Monday’s selling, SODA cracked and now looks to have room to fall toward its 200-day simple moving average (blue line).
Recommended Trade Setup: – Short SodaStream International (NASDAQ: SODA) at $61.25 or higher
– Set stop-loss at $63.50
– Set initial price target at $57.70 for a potential 6% gain in 1-3 weeks
– Set stop-loss at $63.50
– Set initial price target at $57.70 for a potential 6% gain in 1-3 weeks
 RSS Feed
