| MARKET CONDITIONS Readers of my recommendations have seen me suggest the same companies over and over for a reason...they are winners everyone should have in their portfolio. Some of you may push back because you don't have a clue on the options chain. So, I am giving you the EXACT option strategy for you to execute these recommendations. |
"Don't fight the Fed!"
You can hear that phrase on bond-trading desks throughout Wall Street. It's a warning to investors and traders. Don't try to out think the central bank or anticipate its next moves.
Federal Reserve policies and their effects on the economy are like the movement of a giant aircraft carrier. It takes a long time for the direction and momentum to shift. The ships don't turn on a dime or swerve suddenly.
The Fed is the same way. The influence of its monetary policies is pervasive and relentless. If the central bank is cutting rates and trying to juice the markets to keep the economy moving along... you'd better not bet against fixed-income and stock markets.
In my experience working on the desks of a few Wall Street firms, trying to go against the Fed is a bad trade. You'll lose almost every time. But you may ask what happens when the Fed does begin to shift? We don't want to be caught on the wrong side of any new policy, right?
It turns out, we don't need to lose sleep about that, either. Let me explain.
First, always base your decisions on the facts. Don't risk your money on speculations or hypotheses. Look deep into what the data tells you is really happening in the market. Make your decisions based on evidence.
So today, we're going to look at the facts surrounding how markets react to Federal Reserve market policy. I assure you the data tell a different story from the one you're likely to hear about "taper risk" and the imminent demise of the "bond bubble."
And that evidence leads us to add a new position to your portfolio today. It's a stock you probably haven't traded before. This business is in a much-maligned sector. But despite the pressures on its business model, this company is shoveling loads of cash onto its balance sheet and rewarding shareholders with some of it.
Even better, because many investors are leery of the sector, we can open a position at dirt-cheap prices.
Our Portfolio Will Be Fine No Matter What the Fed Does
Let's look at the facts. What would likely happen if the Fed comes out tomorrow and announces, "Great news, the economy is booming and we're raising rates and ending all of our stimulus!" Would that be our signal to run to cash? Not at all. And here's why;
When an announcement is made that rates are rising – whether it's ahead of the Fed's actual actions or an advance warning – stock indexes like the Dow Jones Industrial Average will take a tumble for a few days, maybe a week. But believe me... it'll come roaring back.
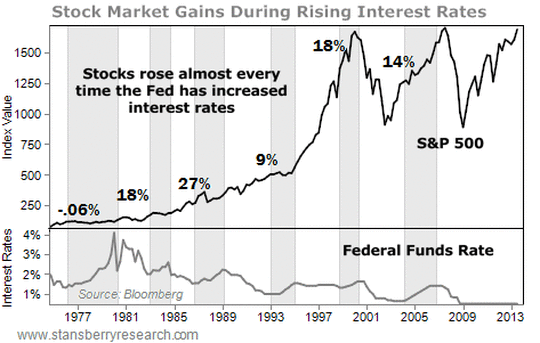
This chart shows stocks for 40 years, essentially my investing lifetime. The shaded areas are the time when the Fed was raising its federal-funds rates. That's the rate it sets for banks to lend each other money. The average gain when the Fed was raising rates was 14%.
That's not a trade I'd want to miss but be thankful that most people don't know that. It makes it easier to benefit from misguided or overblown fears in the stock market. This is why I recommend people stay invested in stocks in their portfolio's asset allocations.
In fact, the U.S. economy continues to grind higher. I don't see evidence that the Fed will declare victory and cut off its bond-buying as soon as some people think. And even if it did, we'd have time to adjust our portfolio before the true effects filtered through the economy. Again, the Federal Reserve's ship does not turn on a dime.
That means a portfolio of well-chosen stocks will continue to perform well. And it means investors should not unload their unleveraged fixed-income positions, either. With a slow-growing economy and minimal price inflation, real returns on almost all securities still look attractive.
Making sure we're in businesses that are shareholder-friendly and will make money in almost any economic environment is one of our core beliefs. If we can buy sales and cash flow at cheap levels, we want to do that trade over and over.
That's why today, I'm turning my attention to oil refiners. Refiners are simple businesses that the modern era has turned very complex. On one level, refining is a straightforward business: You buy oil, turn it into gasoline, and sell it to consumers.
But if you dig into Wall Street's research on refining companies, you'll see all sorts of arcane commentary. Between the different qualities of oil, the different prices in different parts of the country, and the different types of end products refiners can produce... all of it combines to make a complex, unpredictable mess of hydrocarbons flowing through a maze of pipes with wildly fluctuating prices.
If you cut out the noise, this business is predictable, profitable, and a large generator of cash.
Refiners have a simple measure of profitability, called the "crack spread." It measures the difference between the prices to buy oil and sell refined products. When the crack spread is high, refiners make a lot of money. When it's low, they make less.
The crack spread has a self-reinforcing cycle, too. If the spread is low, refiners cut back on oil purchases and reduce gasoline output, causing prices to rise. That causes the cycle to reverse. Refiners see the profits to be made selling more products, and so they buy crude and refine more until the wheel turns again.
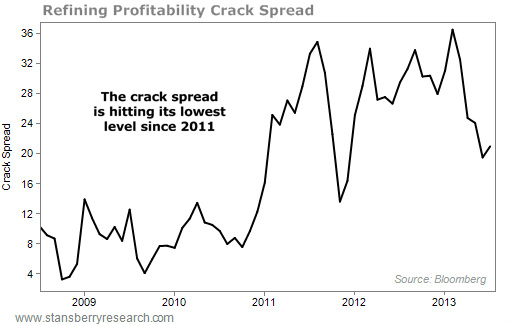
Unless you're trading weekly oil and gasoline futures, you don't need to know any more than that. You can see in the chart below that the crack spread is the lowest it's been since late 2011. And it's starting to turn around a bit. I think the crack spread is at or near its cyclical bottom. That means that refining stocks are near a bottom as well. And their profits should start to turn up again.
We can dig a little deeper, though. In the chart above, you can also see that the crack spread soared in 2010 and seemed to stay at a higher level. (Economists might call this a "structural change" in the industry.)
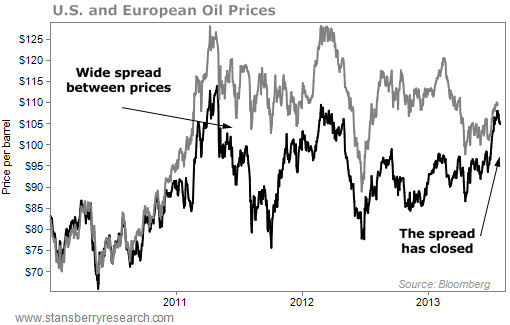
What was behind this surge? It matches up perfectly with a change in another "spread." This one is the difference between oil prices in the U.S. (as tracked by the benchmark West Texas Intermediate crude, or "WTI") and European oil prices (represented by oil from the Brent Sea, or "Brent Crude").
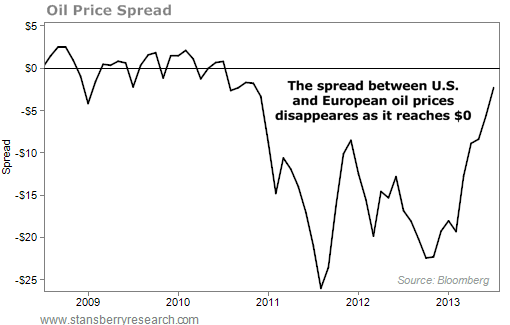
When the spread is at $0, that means WTI and Brent crudes cost the same. When the spread turns negative, that means you can buy WTI at a discount to Brent... that oil is cheaper in the U.S. than in Europe.
You can see clearly in the charts below, U.S. and European oil prices were close until the spread widened in 2011. Now, they're both hovering near $106 a barrel.
When the difference between U.S. and European oil prices was huge, refiners made more money because they could buy cheap U.S. oil and sell gasoline to Europe.
Now that the spread has closed and oil prices have equalized, some people are worried that refiners' profits will disappear. The thing is, spreads have simply returned to a more normal level. This is a good time to seek out a refiner that is still making money (and rewarding shareholders with those profits).
The point is this: There's a pessimism surrounding refining stocks because their profit margins are at a low. But that's exactly when we'd like to buy. Like health care... energy is always in demand. It makes sense to own shares of the makers and movers of energy that make money in almost any economic environment.
Selling a put in this scenario is even better than buying stock, because while I believe refiners will rise, I'm even more certain that they won't fall that much more. That's what put-selling was made for.
My favorite refiner right now is Phillips 66 (NYSE: PSX).
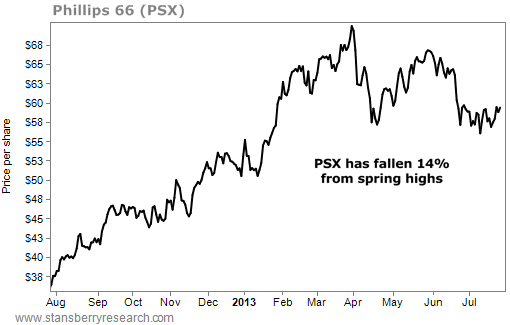
And as you can see from the price chart below, the stock is off nearly 14% from its highs this spring. This correlates well with the peak in the spreads.
Thanks to the narrowing crack spread, Phillips 66 shares are at a six-month low. This 138-year-old, $35 billion company trades for just 7.6 times earnings and 7.4 times free cash flow. (World-class value investor Warren Buffett likes to buy anything trading for less than 10 times free cash flow.)
The stock is cheap, but not because the company is struggling. Refiners have notoriously small profit margins. Phillips' is 3.37%. But they have great returns on equity (ROE). Phillips' is a very high 21%, making it more profitable than 364 of the companies in the S&P 500.
Also note that the company trades at a dirt-cheap 0.23 times sales and less than two times (1.7) book value.
Meanwhile, the stock yields a healthy 2.2% with a super-safe dividend payout ratio of just 10%. (Remember, in general, we look for 50% or lower.) That means the company earns enough to pay out 10 times as much in dividends. So don't worry. Even if crack spreads fall from here and eat into cash flow, Phillips wouldn't need to cut its dividend.
Phillips' stock is so cheap right now that it can't go much lower from here. We may see a dip depending on what happens during the July 31 earnings release. But I suspect value investors will swoop in at any sign of weakness.
Here's How the option for PSX Works. Today, I recommend you:
Sell, to open, Phillips 66 (PSX) September $57.50 puts for around $2.45 with the stock trading around $58.60.
The puts obligate you to buy PSX at $57.50 a share if the stock falls to less than that by option-expiration day (September 20). Selling these puts gives you about $245 in your account per option contract. (Remember, one option contract equals 100 shares of stock.)
Buying 100 shares at $57.50 each represents a potential obligation of $5,750. To put on this trade, you will have to deposit a "margin requirement" – essentially a security deposit that reassures the broker that you can cover your potential obligation. It usually runs about 20% for put sales. (In this case, 20% of $5,750 is $1,150.)
Here's the math.
Sell one PSX September $57.50 put for $245.
Place 20% of the capital at risk in your option account, $1,150.
Total outlay: $905.
If the markets remain unchanged and PSX trades for more than $57.50 on September 16, you won't have to buy the stock. You keep the $245 premium (and the $1,150 margin). That's a simple 21.3% return on margin in less than two months. If we put this trade on every two months – assuming all prices remain the same – this could return 127% a year on the margin amount.
If PSX trades for less than $57.50 on September 20, you'll keep the $245. But you'll have to buy PSX stock at $57.50 per share. So you'll own PSX at $55.05 (the $57.50 strike minus the $2.45-per-share premium). Here's how that scenario works out for each option contract you sell.
Initial income from sold put premium of $245.
Purchase of 100 shares of PSX at $57.50 is $5,750.
Total outlay: $5,505.
The cost ($55.05) is roughly 6% less than PSX's current market price. This gives a little downside protection. Plus, if you become a shareholder, you'll also receive the company's $1.25-per-share annual dividend. If PSX pays its expected dividend over the next 12 months, you'll receive a total of $370 ($245 plus $125 in dividends) on a $5,750 investment 6.4% cash on your investment. And we'll likely sell call options against the stock to further boost our returns.
Note: The prices in this example reflect trading on July 25.
IRA Alternative for PSX
If you're using an IRA or Roth IRA that bars you from selling puts, there's an alternative covered-call trade you can make. (These alternative trades can also be done in your regular brokerage accounts.)
This is the same strategy we use to generate income on stocks that are put to us but if you prefer to start by owning shares and selling calls, the trading strategy works just as well.
The math is nearly identical and the returns are similar when you sell puts versus covered calls (in terms of your potential obligation, the so-called "capital at risk"). As always... for each trade, execute either the call or put trade, but not both.
Remember, with covered-call selling, you are selling a call option and simultaneously buying stock. Thus, the option is "covered" with stock. And when you enter the trade in your trading platform, you should do it as a combination buy/write, or covered call.
This means you will be paying for the stock minus the premium you receive for selling the option – what's called a "net debit."
Here is how the PSX trade works as a covered call.
Buy 100 shares of Phillips 66 for about $58.60, and
Sell, to open, the PSX September $57.50 calls for about $3.40.
This represents a total outlay (or "net debit") of $55.20 ($58.60 stock price minus the $3.40 we receive from the call premium). Remember... you are buying 100 shares of the stock for every call option you sell against it.
Here's how the math works.
Income from sold call premium of $3.40 is $340.
Purchase of 100 shares of PSX at $58.60 is $5,860.
Initial outlay: $5,520.
If PSX shares sell for $57.50 or more on September 20, the stock will be "called" away from you at $57.50 a share. This gives you a net gain of $2.30 per share on the position (the difference between our initial outlay and the price at which you sold your shares). Plus, you'll earn a $0.3125 dividend on August 14. This is about 4.2% in less than two months, for an annualized return of about 27%.
Of course, if the stock trades for less than $57.50, your calls will expire worthless and you'll still own the stock, uncovered. You can keep the $340 premium and the future dividend stream from 100 shares of PSX. That should amount to $125 a year per 100 shares. This is a total of $465 (the $340 premium plus the $125 dividend) on a $5,750 investment, or about 8% this year.
As always, put no more than 5% of your portfolio into this position. And hold it with a 20%-25% stop loss.
Is It Too Late to Get into That Trade?
The prices listed in the section above are from Thursday, July 25 intraday trading. People often wonder what to do if the trade moves a little bit and the prices don't quite match what I've written up in the newsletter. The important thing is to understand that options prices move along with the underlying stock.
An assumption I make is that the "implied volatility" doesn't change much from day to day. (This may or may not turn out to be true. But it's a reasonable assumption over short periods of time.)
The prices people pay for options represent ("imply") the future variability in the price of the underlying stock. If people expect prices to rise or fall quickly, they will bid up option prices. And thus, the implied volatility increases. When people are comfortable and fearless about stocks, they won't pay much for calls or puts. Thus, the implied volatility decreases.
So how does this influence our Phillips 66 trade and what are good prices to accept if the stock shifts around?
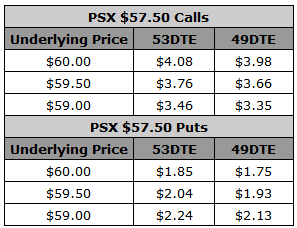
Below, I've created a table that shows how PSX options prices should move over the next week (assuming implied volatility for the options is between 31%-32%). When you go to open a position, compare the date and share price with the table. If you can sell the options near the listed price, that represents a good opportunity to open a position. So for example, if by Tuesday, PSX shares are trading for $59.50, you can safely sell the put for around $2.04 each.
Note that in the case of calls if the stock price drops $0.50, then we will get about $0.30 per share less. Similarly, the more time passes, the less value the call has. So even if nothing else changes by Tuesday, we can expect to receive less for the call.
The same thing happens with put options, except in reverse. That is, the higher the stock price goes, the more the value of the option decreases. The passage of time also causes the put's value to decrease.
Again, please use this table as a guide to help gauge acceptable prices for opening today's trade. (Please note, "DTE" refers to "days to expiration.")
In addition to the PSX trade, I'd want you to sell more options on two familiar stocks that have treated us well in the past.
Understanding the ins-and-outs of a company can lead you to smart trades, but sometimes market trends get so big that entire sectors can make for great opportunities. For that, we turn to exchange-traded funds (or ETFs) to both profit and hedge our bets in the sector.
We've used ETFs before, and two of our favorites have been the Technology Select Sector SPDR (NYSE: XLK) and the Health Care Select Sector SPDR (NYSE: XLV).
Both of these sectors have a massive opportunity. And since they both hold a diversified group of stocks, they have even more safety than an individual stock.
The options trade on XLV closed for a gain of 12.55%. On Monday, we were left holding shares of XLK from our July $32 put. So we rolled these shares into a September $32 call.
The IRA Alternative trades resulted in shares of XLK being called away for a gain of 1.48%, while our XLV shares were called away for a gain of 3.69%.
For today, I've got two new trades on these ETFs:
Sell, to open, the XLK September $32 puts for around $0.90, with the stock trading at $31.60, and
Sell, to open, the XLV September $50 puts for around $0.80, with the stock trading at $50.80.
These trades work in the same way as the PSX put sale.
For IRA Alternatives in these same stocks, I recommend you:
Buy 100 shares of XLK for about $31.60, and
Sell, to open, the XLK September $32 calls for about $0.40.
Buy 100 shares of XLV for about $50.70, and
Sell, to open, the XLV September $50 calls for about $1.20.
Please note: The prices I've listed for the XLK and XLV trades are up to date as of midday trading Friday, July 26. Please try to get prices as close as possible to the ones listed. To recap, here are our trades for this month.
Strategy: Please "sell to open" the following puts:
Or if you're doing our covered call IRA Alternatives: Please buy stock and sell a call option accordingly:
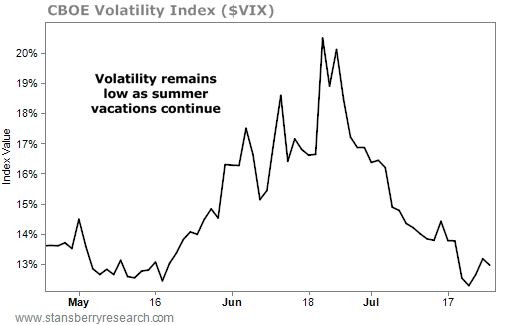
| The Volatility Index ("VIX") is dropping even lower, as we've expected due to the natural history of the summer's trading doldrums. Recall that the index reflects the prices people are willing to buy and sell options that are regularly used to protect the value of their stock holdings, and for some to speculate on the upside. A high VIX often indicates fear in the market as investors are willing to pay more to insure their stocks – usually through buying puts. The low VIX we've seen recently isn't surprising. As I explained earlier this month, summer months tend to be slow as people spend time going on vacation (even the Wall Street heavyweights). This means things are mostly quiet across the market. Things could start to heat up later this summer... and we'll be ready to make even more using options. | What If You're Holding BP BP closed trading last Friday at $43.01 a share... below the strike price of the puts we were holding – the BP (BP) July $43 puts. Since Friday was option-expiration day, that meant our options expired worthless. I closed the position and recorded the 11.6% gain. But some investors may be put shares. This is somewhat unusual, but it can happen if the traders holding our puts want to sell their shares before the weekend. And it can also be caused by daytraders (hedge funds even) playing with long and short positions in the BP market, using the underlying in the waning trading hours right before expiration. When this sort of thing happens – exercising out-of-the-money options – we celebrate. This is offering a great opportunity to make even more money. If you were put shares, you can now sell them for more than the $43 strike price (with the stock trading at $43.45) and lock in a gain of 3.5% (13.8% annualized) in just two months. Or you can continue collecting income by selling calls. For the sake of investors who were put shares, I'm going to suggest a call you can sell to generate some income. However, this is only if you were left holding BP stock. In that case, I recommend you: Sell, to open, the BP September $43 calls for around $1.20 or more. Again, this is only for people who were left holding shares of BP. If your put expired worthless, you don't need to take any further action. |


 RSS Feed
