The Millionaire Maker Investment Advisory
  • Introduction
  • Market Conditions
  • Commodities Corner
  • Featured Interview
  • Understanding Markets
  • Understanding Money
  • Understanding Value
  • The Tax Shelter
  • Retire Rich
  • Radio Blog
  • Contact

Revisiting the Safe Withdrawal Rate

9/23/2013

0 Comments

 
Picture
RETIRE RICH

You probably have heard about the magic of the 4% rule, or the safe withdrawal rate. Unfortunately, this rule never was magic and now needs to be re-examined and revised. Otherwise, too many retirees are at risk of running out of money.

By Bob Carlson


The 4% rule was generated from attempts to answer the question: How much can I safely withdraw from my retirement portfolio each year without taking a high risk of running out of money? Studies using databases and Monte Carlo computer simulations derived what became a consensus conclusion among financial planners. A retired person or couple can withdraw just over 4% of a nest egg the first year, and then the next year can increase that dollar amount by the inflation rate for the previous year. After that, the dollar amount of withdrawals can be increased for inflation each year.

In the studies, under these terms a standard diversified portfolio (usually 60% stocks and 40% bonds) would last at least 30 years 90% or more of the time. The most difficult times for the strategy were when someone retired early in an especially negative economic period, such as the late 1960s and early 1970s.

Despite the professional consensus for the 4% rule, for the most part people draw down their nest eggs more rapidly. Younger retirees tend to withdraw money at a faster than older people are required to under the IRS's required minimum distributions, according to a recent survey by the Employee Benefit Research Institute. Other surveys show that people tend to believe they safely can withdraw 7% to 10% annually without a problem. Perhaps that is one reason why most people in the U.S. die with only about $10,000 in assets to their names, regardless of their financial condition entering retirement.

I've always warned my readers to be cautious about the 4% rule. For some people, even 4% is too high a withdrawal rate, while for others it is too low.

The rule has many shortcomings. Its measuring period ends at 30 years, which is too short for more and more retirees. You also can change the results by altering the investment mix or strategy. Many people won't have 60% of their retirement portfolios in stocks and so probably should have a withdrawal rate lower than 4%, because they'll earn lower returns. Others have more balanced portfolios or other differences in strategy that justify a higher withdrawal rate because of higher investment returns.

Also, while 90% or higher sounds like a good confidence level, it's really not when you live in those few periods when the strategy fails. During those periods, the failure rate is 100%. Also, the confidence level doesn't answer two key questions: By how many dollars and how many years does the strategy fall short? The extent of failure makes a big difference, because it tells whether you can avoid failure by making small adjustments along the way or need a major overhaul to save your retirement.

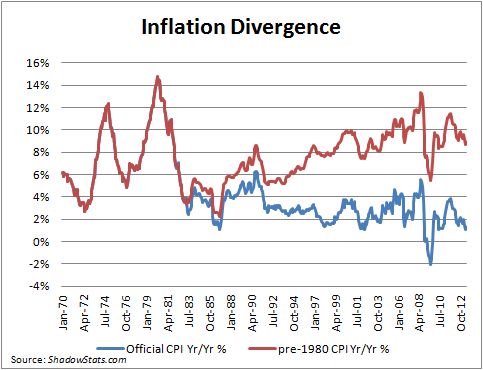
More people are raising questions about the 4% rule. In addition to the above criticisms, they're pointing out that we've been in a period of low interest rates and below average investment returns for some time, and that is likely to continue for a while yet. Using historic investment return patterns isn't relevant to today's retirees. I've seen some studies argue a more appropriate safe withdrawal rate today is 1% to 2%.

For most retirees, however, the underlying approach is wrong. The 4% rule and its methodology are good benchmarks or starting points, but they aren't the final answer. People simply don't spend money the way it is modeled in these studies.

Instead, you should have a more dynamic and flexible spending plan. I usually recommend you consider two strategies, or combine them.

One strategy is what I refer to as the Yale Endowment Strategy, because it is based on the distribution strategy of the Yale University Endowment. The university wanted distributions to fluctuate somewhat with investment returns, but it wanted changes to be gradual. The university can't plan its budget if contributions from the endowment are as volatile as the investment markets.

They came up with a two-part formula. One part is very similar to the 4% rule, and it determines 70% of the distribution. The other part determines 30% of the distribution and fluctuates with the size of the endowment fund. So, the second part will rise or decline in line with the net effect of contributions, distributions, and investment returns. You can adapt a version of the Yale University Endowment formula as your retirement spending plan.

The first step is to set the withdrawal percentage for the first year of retirement. Let's say you choose 4% of the portfolio's value. Using the principles of the Yale Endowment, for the first year you spend 4% of the portfolio's starting value.

After the first year, use two separate formulas. The first formula is last year's distribution amount increased by the inflation rate for the last year. Multiply that amount by 70%. The second formula is your initial withdrawal rate multiplied by the fund's value at the end of last year. Multiply that result by 30%.

Add the two results together to get the distribution for the year.

Here's an example. The withdrawal rate is set at 4%, and the initial portfolio value is $600,000. The first year's withdrawal is $24,000. After the first year, the portfolio's value is $604,800 (The initial value minus the first year's spending plus a 5% investment return). Inflation was 2%. Using the first formula, 2% inflation is added to $24,000, then multiplied by 70%. That result is $17,136. Under the second formula, $604,800 is multiplied by 4%, and then by 30%. The result is $7,258. Add the two amounts together and the second year distribution is $24,394.

Under this formula, spending fluctuates with the markets and inflation, but the changes are not as volatile as the markets and inflation are. If the markets experience an extended decline, spending declines gradually. During bull markets, spending increases faster than inflation but not as rapidly as the portfolio increases. That allows you to enjoy some of the excess gains of a bull market, but the spending does not rise enough to absorb all the investment gains. That leaves a cushion against the inevitable market downturns and allows you to have a smoother spending pattern.

The other strategy is based on actual lifetime spending patterns as revealed in Department of Labor surveys. I call this a natural spending cycle.

Spending varies by age. Even after retirement there are several cycles. For most people, annual spending peaks around age 50 and then steadily declines, according to the Department of Labor's Consumer Expenditures survey.

A spending model that accurately reflects the historic spending of Americans divides retirement into three phases. In the first phase, spending is highest (though as indicated, still lower than at age 50) because the retirees are healthiest and most active. They tend to have some pent-up desires for activities and spending. It's not unusual for retirees in the first few years to spend as much or more than they did during their last working years.

In the second phase, they slow down a bit physically and have checked off a lot of items on that Bucket List. So, in this second phase spending is less than in the first phase of retirement. The amount of the reduction varies among retirees, but overall there's a clear reduction. In the third phase, after age 75 or so, spending slows again. The spending reduction after age 75 can be significant, because many people are physically less active or aren't able to do things they used to.

Based on this data, retirees can plan for a three-stage spending cycle.

The first stage can be referred to as the honeymoon period of the first few years. This is when the retiree has pent-up demands and also is relatively young and healthy. After that period, the lifestyle becomes more normal and regular. Spending settles at a level that is lower than during the initial years of retirement. Sometime after age 75, spending is likely to downshift again.

The Department of Labor studies indicate that spending by those over age 75 is 25% or more below that of younger retirees.

This pattern of spending, of course, is very different from that assumed in the 4% safe spending rate model and some other retirement planning models. What the 4% rule is really good for is telling you whether the level of spending you plan for the first year of retirement is reasonable. If your planned nest egg distribution the first year of retirement is well above 4%, review and reconsider your spending plans.

There might be a fourth spending stage in which major medical expenses or long-term care expenses are incurred. Often when this occurs other living expenses decline. The total expenses incurred by the retiree during that period depend on the extent of insurance coverage and the level of care needed. It also depends on whether there is a spouse who needs to remain in the marital home while the other spouse enters a long-term care facility. This is why medical and long-term care expenses are the wild card in retirement planning.
0 Comments

A 'No-Brainer' Income Strategy For Anyone With $1 MillionĀ 

9/11/2013

1 Comment

 
Picture
RETIRE RICH

Investing well isn't about flashy and confusing charts or subscribing to pricey and highly ineffective advisory newsletters. It's about using a common-sense approach to allocating your money into the safest blue-chip performers in the market. I can't stress it enough... wealth is created over time and dividends are the less volatile means of achieving it. 

By Amy Calistri
 

Most people don't have a million dollars to invest. It doesn't matter. What I'm going to show you applies no matter how much money you have to invest -- whether it's $100 or $100 million. But there is a sad truth about a million dollars. Even that heady amount wouldn't earn you much in regular income -- if you put it to work in the "traditional" ways.

$560. That's the most you will get each month if you put that $1 million into a 1-year CD, which, according to BankRate.com, is yielding just 0.67%. For comparison, the average Social Security check is $1,266 per month. In other words, you'd earn more from Social Security than you would from $1 million.
Picture
It's a similar story with a number of other investments.

10-year Treasury Note -- Sitting near historically low levels, if you loaned the federal government $1 million, with annual yields at 2.9%, you'd only earn $29,000 a year... or $2,900 a year on $100,000.

Savings Accounts -- With a maximum yield of 1%, the absolute best you'll get from a savings account according to BankRate.com right now is $10,000 a year.

Corporate Bonds -- If you invest in the right investment-grade corporate bonds, you could net roughly 3.5% a year on $1 million -- generating $35,000 a year in income. Not a bad amount of money to bring in each year, if it didn't require a million-dollar investment. A portfolio of $100,000 would earn just $3,500 per year.

S&P 500 -- You could also simply buy an index fund with your million dollars. With an average dividend yield of about 2%, you'd earn about $20,000 a year if you invested alongside the S&P 500.

The sad truth is that even with a million dollars, your options for income with "traditional" investments aren't very comforting. But there is some good news.

As of now, I'm earning $16,750 a year (or almost $1,400 a month) on a portfolio of securities currently worth $250,000 using my "Daily Paycheck" strategy. If my portfolio were worth $1 million -- four times as much -- I'd be earning $67,000 per year. That's considerably more than you can earn from Treasuries or CDs or the broader market.
Picture
Of course, there's a big difference between a portfolio of dividend payers and simply putting your money in a CD, Treasury or even a broad index fund that tracks the S&P. I'll be the first to tell you that it's hard to match the safety of a U.S. Treasury bond if you hold it to maturity. But you might be surprised how stable a "Daily Paycheck" portfolio can be.

Let me give you one example...

You may remember the market sell-off that occurred back in August 2011. All the headlines were dour... investors around the world were anxious about a potential default by Greece, high oil prices, budget problems in the United States and elsewhere and soaring unemployment.
The S&P 500 lost 5.7% in the month of August alone; a major move for one of the world's most recognized indices.

My portfolio? Despite all the turmoil, my account fell just 1.0% during the month. That's roughly one-sixth the amount the broader market fell.

That's not to say my portfolio will always hold up as well, but I do like my odds. After all, the last time I checked, the S&P wasn't throwing off thousands of dollars in income each month, helping to smooth out returns no matter which way the market moves.
1 Comment

A Special Report On Inflation

9/6/2013

0 Comments


Picture
RETIRE RICH

I chose to put this article I saw in this section because I hear so many times even from my own parents that, "if I just let the money sit in the account it will be there when I need it years down the road".  Yeah, right! Inflation erodes our wealth and eats into any residual profits. That's why we as investors need to always have a strict strategy in place to thwart what Ronald Reagan called, "The Thief in the Night". After you read it, I hope you're scared...very SCARED!

Your wealth is in imminent danger!

By Phil Ash


Thirty years ago, Ronald Reagan gave this insidious robber a name: "the Thief in the Night". Now this stealthy crook is out to steal 10% of your wealth this year and 50% by 2018.

Four warning lights are flashing on our financial dashboard, signaling that we've entered a dangerous era of "Preflation." You may not be familiar with the term, but I think you get the idea. It probably wouldn't surprise you to discover that your money's buying power is being stolen while you work, play and even while you sleep.

In this current period of Preflation—i.e., the steady run-up to what
will likely be 1970s-style double-digit inflation—you're being robbed
every hour of every day.


It doesn't matter how smart an investor you are. Even worse, inflation invades like a cat burglar—so quietly you barely notice until you realize HALF YOUR BUYING POWER HAS VANISHED in less than five
years.

It's happening right now and it's just the beginning.
Sooner than most folks imagine, thousands of investors will look back and wonder "why didn't we recognize the blatant theft of our wealth while it was happening right in front of us?"

Here's why: "The Thief in the Night" is being aided and abetted by one of the biggest lies in our nation's history.


The "422% Lie" Deliberately Spread By Our Own Government

The four indicators flashing red today warn of an inflationary surge that will attack your wealth and deal a nasty wallop to anyone who depends on investment income. These indicators are the classic predictors of soaring inflation. In fact, they have preceded numerous bouts of hyperinflation in the past century.

They are: (1) persistent global unrest and multiple ongoing wars; (2) intense international competition for critical commodities; (3) massive government spending; and (4) continuing currency debasement (in the U.S. we call this QE 1, 2 and 3.)

I suspect these conditions have a familiar ring. In fact, they're the day's top headlines—and they don't bode well for investors and savers.
Ultimately, should these conditions persist (as I believe they will), many folks will find themselves **running out of money in their lifetime.**

Slow-Motion Robbery Is Still Robbery


At the moment, we are in a period of "Preflation." Today's inflation is like a jet on the tarmac powering its engines prior to takeoff.
Rather than roaring down the runway on a straight line to hyperinflation, there will be speedups and slowdowns.

This volatility, as in the past, is distracting investors until the worst possible time—when it's too late, **after** they've discovered the Thief in the Night has robbed them blind.

The time to protect your wealth is NOW.


You can't trust the government's reporting of the actual cost of living. As you're about to discover below, the official CPI number is one of the most shocking examples of government "disinformation" in our history.
You can't stop inflation yourself but you CAN do something besides helplessly watching your money erode. You can even make double-digit profits if you follow exactly the right strategies.**

I believe
that we are perched on the precarious limb of Preflation—though we both doubt one investor in 10 realizes it. Don't look for headlines warning, "Inflation Is Back." Rather, there will be an awful awakening one day down the road when millions of investors realize that inflation—drip by drip—has drained away their wealth.

As obvious as it might seem to you and me, preparing for inflation is a step that most people will never take. Because most people like to pretend that the government has things under control.

Surely the SEC was looking out for investors, making sure that the dot-com start-ups raising billions of dollars were legitimate businesses and not run by fraudsters, right?
Surely regulators were preventing banks from making no-money-down loans to people with no jobs and allowing them to buy multiple homes, right? Surely our own government would never recklessly spend so much money that it had to run the printing presses day and night, sapping the value of our savings and threatening the very existence of the dollar. Right?

A Cruel Lie

At this very moment, thousands of Americans believe their investments will reward them with a rich retirement—unaware that the buying power of their nest egg is melting away.
And their own government is NOT warning them. Instead, it's feeding them false numbers and disinformation.

Take the retired small business owner who believes his hard-won nest egg of $400,000 will actually be worth $400,000 in buying power. In fact, it's losing almost 10% of its value this year and is likely to be worth 50% less in five years.

A soon-to-be-retired couple would be stunned to discover the income from their $1 million portfolio will buy only HALF as much before the decade is over.

In short, the U.S. government's repeated assurance that inflation is below 2%—and thus nothing to be concerned about—is a lie of breathtaking magnitude.

Because in truth t
oday's REAL inflation rate is closer to 10%—a staggering 422% higher than the official number our own government is hoping we'll believe. Here are the facts: The "official" inflation rate according to the government is 1.8%. But the "rea" inflation rate is actually 9.4%—a staggering 422% higher.

Of course, we all know politicians tend to lie—and lie easily. It really doesn't matter if they're Democrats or Republicans, liberals or conservatives; most of them play fast and loose with the truth.
But it DOES matter when they lie about something such as inflation—you need to know the truth about.

Imagine visiting a doctor who lies to you about the severity of an illness. Well, our country's money is "sick"
and threatening your future—and the quacks in Washington are telling you, "Don't worry, you're fine!"

How the Lie Is Spread

It begins, as you might expect, deep in the bowels of the federal government.
Down here, the "official" inflation rate, known as the core Consumer Price Index (CPI), is concocted and issued by the Bureau of Labor Statistics (BLS). (As you'll see, the term "core" is brilliantly devious—it allows
politicians to finagle the inflation number any way they wish
.)

Yes, the BLS bureaucrats themselves are supposedly "non-political."
Yes, the CPI number disseminated by these government bean-counters is the one you almost always read in the paper or hear on TV. To most Americans, the CPI is the trustworthy rate of inflation, the gospel truth. After all, didn't their own government determine the number and their favorite anchorperson confirm it on TV?

But is the figure really credible?
You be the judge. The latest BLS release—I have it right in front of me—puts the core CPI at just 1.8%. That's quite low by historical standards. However, there are strong reasons you should regard this number with extreme skepticism. Chiefly because the core CPI—the "official" rate of inflation—has been brazenly manipulated over the past three decades for political
purposes.

For example…

If the rate of inflation were still calculated (as it should be) the way it was back in 1980, it would be a staggering 9.4% and angry citizens would be storming Washington with pitchforks.
The graph below reveals the truth.

Note: The red line indicates inflation as calculated by the formula the BLS used in 1980. The blue line represents today's formula.

Picture
As you can see, inflation surges during the Ford and Carter administrations, then drops sharply during the Reagan years, with the U.S. enjoying the longest economic boom in its history.

However, when Reagan departs the White House, REAL inflation (the red line) begins its steady rise again—but the official CPI version (the blue line) remains curiously lower than the red line.

Why the divergence?
Answer: Political manipulation of the core CPI. Count on it! If the Gipper were alive today, he'd be thundering. "Mr. Obama, tear down this phony CPI!"

After all, how can you trust a CPI that excludes energy costs simply because they are "too volatile"?
How can you trust a CPI where tofu replaces steak when the price of beef goes up?

Yes, that's what they do at the BLS when the real inflation numbers are politically inconvenient! They call it "substitution."
I call it a scam.

The game wasn't always rigged this way. Originally, the CPI was determined by comparing the price of a FIXED basket of goods and services at two points in time. So there was no way to fudge it. But now, if the price of steak goes up and people eat tofu instead, the BLS reduces the weight of steak prices in the CPI formula. Voila, less inflation!

The Fox Is Guarding The Henhouse
Think about it: The politicians and bureaucrats who create inflation in the first place also get to decide how to measure it. If that's not a conflict of interest, I don't know what is. If we were just talking about abstract statistics, I wouldn't care. But this deception is doing real harm to millions of Americans. These phony
low-ball CPI numbers not only shortchange anyone who receives payments tied to the cost of living, but they're hiding a cancer in our economy that will eat away at every asset you own.
Let's call this practice what it really is: disinformation spread by a government addicted to racking up trillions in debt.

I live in Washington, about four miles from Capitol Hill. My neighbors on both sides of the block are Congressional staffers and campaign hacks.
These D.C. denizens are, first, last and always, "men and women of government" and their Number One goal is to create and market more of the only "product" they know: "government".

Which requires them to spend and spend—even if they have to print money by the trainload.
And that's the rub. It's an ironclad law: If you print too much money, it loses value. The more dollars our government prints, the less each new dollar is worth. Why do you think a dollar from 1942 is worth just 7¢ today?

The Gas Pump Isn't Lying

Picture
You don't need a chart to realize prices have been rising for just about everything you buy. You know you've been paying more lately for gasoline, food, clothing, rent—you name it.

But your own U.S. government keeps flat-out INSISTING that inflation is low and not a threat. You live in the real world—so you know differently.
Just five years ago, the average price of gasoline was $1.84 a gallon. Currently, gas costs about $3.60—up more than 95%. In some cities, signs read $4.00 a gallon. But not to worry. Gasoline, which is energy-related, isn't calculated into the core CPI. Nor is the 42% more you've been paying for electricity since 2002. (Like the proverbial tree that falls unheard in a forest, if a price increase isn't counted in the CPI, it never happened—at least according to the government.)

Are you paying for a child's or grandchild's college education? Since 1986, the cost has risen a mind-boggling 598%.
Since 2002, you're paying:

26% more for milk…

73% more for eggs…

90% more for coffee…

39% more for a loaf of bread…

56% more for turkey…

44% more for spaghetti…

143% more for margarine…

61% more for ground beef…

The average increase over the past 11 years for each of these everyday items: 48.3%.
And that's just for supermarket staples. What about something BIG—like healthcare?

Since 2002, healthcare costs have more than DOUBLED for American families, according to the independent Milliman Medical Index.
As of 2011, counting both employee and employer contributions, the total healthcare costs for a family of four have soared to over $19,000 per year—up more than $10,000 in just nine years. This has already placed a huge burden on both employers and workers. But
it may become worse—far worse.

According to a new report released by the U.S. House Energy and Commerce Committee, Obamacare could raise the average health insurance premium by nearly 100%.
Scary? Of course it is. But what should frighten investors out of their skin is what creeping inflation can do to their investment income.

The Retirement Wrecker
If you've never invested when inflation is high, it's a house of horrors. Just ask anyone who tried it in the 1970s.
Most of your stock gains will be steadily washed away, like castles in the sand. If you're retired and dependent on income, inflation could decimate your lifestyle. That's no exaggeration—just fifth-grade arithmetic.

Today's 9.4% real inflation rate makes mincemeat of the pathetic returns on Treasuries, CDs and money market accounts.
It even wipes out solid 4%… 6%… and 8% dividends on high-yielding stocks (if you're lucky enough to have them).

Imagine you're retired
with a nest egg of $750,000. Let's say you've been earning about 4% on your money.
That's $30,000 of income per year you can take out without touching your principal—and it's crucial to maintaining your standard of living, right?

The bad news is that even at the government's phony 2%-to-3% inflation rate, that $30,000 is actually worth only $29,100 when you spend it at the end of the year, and it will dwindle to about $22,000 just 10 years from now.
But that's ONLY if you believe the official CPI—which is like swallowing financial hemlock.

Remember, REAL inflation as calculated using the BLS's own 1980 formula is 9.4%… meaning your money's buying power is shrinking THREE TIMES FASTER than the government admits.
Look what happens to $30,000 of income when inflation hits 9.4%.
Picture
One thing you can say about inflation: It doesn't discriminate. It's an equal-opportunity dream destroyer.
Inflation ravages everyone, rich or poor.

Let's say you've done well—your nest egg is worth $1 million. Did you know that every single percentage-point rise in inflation rips $10,000 from your real wealth—and continues ripping you off year after year?

Imagine what would happen to your personal standard of living if "official" inflation jumped by five… six… or even seven points… and REAL inflation reached double digits.
Picture
Yes, it's an ugly picture—but frighteningly possible. After all, official inflation hit 15% under Carter in 1980. Who says it can't happen again? Especially with the Fed's multiple rounds of Quantitative Easing, which printed money by the truckload.

Even "good" news can hold inflationary danger.


Suppose the snail-like economic recovery suddenly picks up speed. Against the background of years of record-breaking deficit spending and non-stop currency debasing, a red-hot economy would put enormous inflationary stress on the dollar.

History is full of examples of aggressive currency printing leading to rampant inflation. Look at Argentina today. It's an advanced, First World nation. It has rich natural resources, a highly literate population and a diversified industrial base.

Right now in Argentina, inflation is 24.9%. It's forecasted to reach 30% next year. I'm not predicting that for the U.S. any time soon, but the point is that if it can happen to them, it can to us. At 9.4% real inflation, we're already one-third of the way there.

Imagine how the purchasing power of your income would plummet in that scenario. When official inflation (calculated with the current, highly politicized method) hits 9% or even 10%… real inflation could easily top 30%.

Hyperinflation is truly frightening, and it's happened 47 times around the world since 1944. And it will clobber your wealth—eating it away so rapidly that it leaves you facing the ultimate financial catastrophe: outliving your money.

The reality is that fiat currencies always fail eventually—for one simple reason: Governments overspend and overpromise. It's in their DNA. The message is clear: It's time for a strong, anti-inflation defense

perimeter around your nest egg.

Given the historic level of government debt and massive printing of debased dollars, I give us a 50% chance of entering hyperinflation in the next five years. Failing to develop a strategy to deal with serious inflation is like driving in the dark with no headlights.

Remember, those key indicators I spoke of—persistent conflict, intense global competition for commodities, massive government spending and relentless Federal Reserve money printing—are still in place. Worse, I see no easy end to any of them.

Whenever the Fed even so much as hints at the end of QE and higher interest rates, the markets react violently to the downside. No one in Washington wants to take the blame for derailing the economy—again.

Note also, the U.S. isn't the only country aggressively stimulating its economy. Central banks around the world are running their own money-printing programs. We've got a tidal wave of liquidity chasing the same goods and services—the classic runaway-inflation scenario.

The Question Remains…What to do about it?


America's last period of high inflation, the 1970s, happened four decades ago. The era of disco, leisure suits and double-digit inflation is a distant memory to most financial advisors.

Many of today's advisors weren't even alive when President Ford handed out "Whip Inflation Now" buttons and Jimmy Carter set price controls on oil and gas. But we were there in the trenches, helping investors through the most vicious American bout of inflation of the 20th century.

We're convinced that the specter of inflation—the Thief in the Night, as President Reagan so aptly named it—is stalking investors once again. A crucial point to take to heart about inflation is…Not everyone loses money.

Even during the stagflation horror of the 1970s, many investors profited, and some actually built fortunes.
They did a lot more than protect their existing wealth. They actually leveraged inflation to make themselves richer. You can do the same today. Just as in the '70s, a handful of investments exist that can earn you double-digit profits no matter how hard inflation hits in the next few years. In fact, the harder it hits, the more money you'll make.

Be warned: Many of the traditional safe havens and inflation fighters you'll hear bandied about on the financial channels aren't working like they used to.

For example…

Should you seek refuge in cash? Not in these unusual times. With real inflation approaching 10%, cash equivalents like T-bills and money market funds don't yield nearly enough to keep up. For most of the past decade, cash has paid next to nothing because central banks are holding rates down.

Do the math. How do the 1%-to-3% returns typical of today's cash equivalents fare versus 9.4% real inflation? It's a mismatch—inflation wins in a knockout.

What about stocks? Rising inflation will take a toll on most stocks. Never forget, rising inflation debases the U.S. dollar—as well as any asset tied to the dollar, including stocks. While corporate profits might rise, stock prices won't follow suit, because P/E ratios tend to drop with inflation.

During the 1970s, the S&P rose an average of 4.4% a year, but inflation averaged 7.3%. Even factoring in dividends, stock owners found their principal was worth only 74% of the value it held at the start of the decade. Indeed, a snapshot of the years 1976 to 1982 shows the Dow plunged more than 25%. These years will forever be recalled as a nightmare for stocks. Investors fled the market in droves—some never to return.

What about TIPS? You've no doubt heard much chatter about TIPS—Treasury Inflation-Protected Securities. TIPS come with the guarantee that their face value increases with inflation. Sounds good. However, beware: TIPS are tied to the core, or "official," CPI, which, as we've amply explained, is a fraud. So as you read this, TIPS are recognizing inflation as 1.8% and paying accordingly, while the true inflation rate gnawing away at your money is a whopping 9.4%.

What about gold? It's long been a traditional inflation hedge, but that assumption has come under serious fire as of late. Gold isn't exactly glittering these days. The yellow metal peaked in 2011 after investors flocked to it in the panicky years after the Crash of 2008. Now that most folks no longer feel financial Armageddon breathing down their necks, money is flowing out of gold.

You can do better—much better—than relying on the old ways to guard against the Thief in the Night.


Smart Strategies to Grow Your Wealth
If you get into the right assets beforehand, you'll actually welcome inflation when it hits. Because those assets are leveraged to rising prices, and will increase your wealth while millions of your fellow citizens grow poorer.

Chief Strategist Ben Shepherd, a recognized ETF, mutual fund and stock expert, has spent years studying and writing about macroeconomics, and is confident that wealth-sapping inflation is not a matter of if, but when. Ben is also an accomplished stock picker, where he looks for profit plays in Brazil, Russia, India, China and other rising economic powers.

From the market bottom on October 27, 2008, through the end of 2012, Ben's portfolio has returned 196.0%. That crushes the return of his benchmark, the MSCI Emerging Markets Index. And it's also a heck of a lot better than the 84.6% gain turned in by the S&P 500.

Ben has enlisted Richard Stavros to help him keep his finger on the pulse of inflation for you. Richard advises corporations, investment houses and governments on corporate valuations, mergers and acquisitions, and various strategic initiatives.

Ben and Richard agree with me that we're now in an unusual, perhaps unprecedented, economic situation we've decided to call "Preflation." You can think of Preflation as a rocket in countdown mode. But it won't be like a spectacular launch at Cape Canaveral.

In fact, it's hard to know exactly when this Preflation rocket will blast off and reach hyperinflation altitude, because we've never seen a period exactly like the one we're facing today. There is no real parallel. Never before has a central bank pumped so much money into an economy—$85 billion per month at last count.

The Federal Reserve has injected $2.5 trillion into the U.S. economy since 2008, in an effort to keep interest rates low and spur economic growth. History shows that whenever a country prints even half as much money as the U.S. has and artificially keeps interest rates low for years; the end result is inflation.

It won't be long before you can divide investors into two distinct groups: those who prepared for the wealth destruction inflation inflicts—and those who never saw it coming. It's time to make sure you're in the first group.

The Inflation Blacklist: Investments Guaranteed to be CLOBBERED by Inflation. Do you own any stocks at the mercy of commodity prices (like General Mills)? How about any REITs leveraged to the hilt (like American Capital Agency Corp.)? Or companies that could run into a wall when fuel prices spike (like Swift Transportation)? Dump them. These stocks are highly vulnerable to inflation. And there are dozens more. We name names in The Blacklist. If you own even one, you need to replace it now.

You take deductions to reduce your tax bill, don't you? So why pay the full "inflation tax" of 9.4% when you can limit the bite inflation takes from your wealth?  Remember, many investors in the 1970s became rich by switching to investments that PROSPER during inflationary times. There is no reason you shouldn't do the same.

Please don't make the mistake of ignoring the problem, hoping it will pass. A lot of people will stick their heads in the sand, realizing too late that they should have done something when they had the chance.

Lately, I've noticed columnists calling for price controls on medicine… a South Carolina legislator demanding price controls on gas and the Massachusetts Attorney General recommending hospital price controls. Beware. There's no surer sign higher inflation looms than when politicians and journalists start howling for price controls.

Remember, the Thief in the Night is an "equal-opportunity portfolio robber." Inflation relentlessly steals wealth—regardless of your age or experience. No one is immune except those who defend their money.

Stop the thief.
0 Comments

    RSS Feed

    Archives

    January 2014
    November 2013
    October 2013
    September 2013
    August 2013
    June 2013
    May 2013

Powered by Create your own unique website with customizable templates.