| RETIRE RICH Between the actions of the Fed and the patsies in politics, there should be no surprise as to the conditions of our country's economy and our currency. Just prepare yourself for the after effects of the US dollar no longer being a reserve currency. For a common-sense approach toward surviving these inflationary times click here. |
Ever since the world's central banks joined together to print money out of thin air, analysts have debated which currency would devalue the fastest. Would it be the yen, the euro, or the dollar? With the race well under way, these currencies are sprinting down the track and the dollar has a comfortable lead. In the past five months, the dollar has fallen 5%. Meanwhile, the euro has gained 3%, and the yen is up more than 5%. And based on the following chart of the dollar index, the dollar has even further to fall.
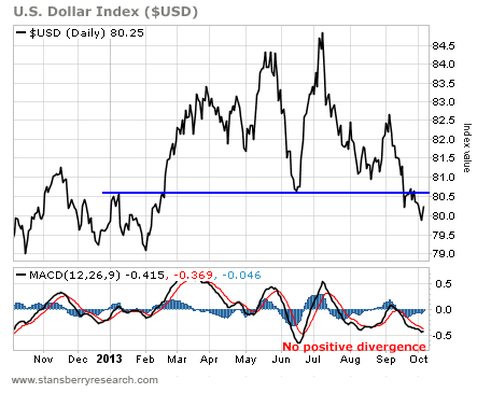
When we last looked at the buck back in May, the dollar index was trading at its highest level in three years. We argued the greenback was poised for a quick decline, and that's exactly what happened. The buck dropped 5% in just a couple of weeks. Today, the greenback is trading near its lowest price of the year but it still looks like it has lower to go. Look at the bottom graph of the chart, which shows the MACD momentum indicator.
The MACD indicator helps determine the strength of a trend, and it often provides an early warning sign for reversals. For example, if the chart is in a downtrend – making lower highs and lower lows – but the MACD indicator is moving higher, then it indicates the downtrend is weakening, and the chart may be ready to reverse and move higher. However, if the chart is making lower lows and the MACD is also trending lower, then the downtrend is strong and likely to continue.
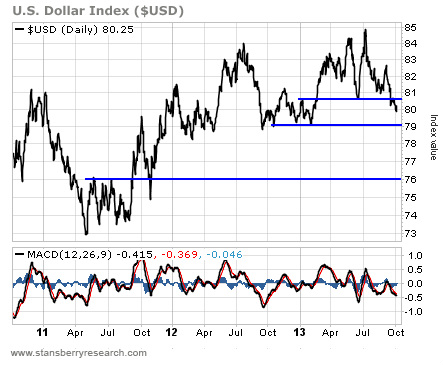
The chart of the dollar index doesn't show any positive divergence. So the downtrend is intact, and the buck has further to fall. The next obvious target for the dollar is at the support line connecting the November and February lows at 79. But if that doesn't hold, things could get ugly. Take a look at this longer-term chart...
A break below 79 will bring the support line at 76 into play. Either way, it looks bad for the dollar. Only an immediate move back above the previous support line near 81 could help turn the picture slightly bullish. Otherwise, look for the dollar to maintain its lead in the currency race to the bottom.


 RSS Feed
