The Millionaire Maker Investment Advisory
  • Introduction
  • Market Conditions
  • Commodities Corner
  • Featured Interview
  • Understanding Markets
  • Understanding Money
  • Understanding Value
  • The Tax Shelter
  • Retire Rich
  • Radio Blog
  • Contact

This Stock Keeps Rallying Higher

11/9/2013

0 Comments

 
Picture
MARKET CONDITIONS

When I last mused about the state of Tesla Motors (TSLA), it was Aug. 15 and TSLA had just pulled back for a few days, allowing traders to take a little breather and evaluate the stock from a few steps behind the ropes.

My mental note that day went on to discuss how a first “correction” (if and when) would take Tesla stock toward its 50-day simple moving average, yet before I could even finish the thought, the stock continued its upward ramp, and now (six weeks later) closed roughly 30% higher.

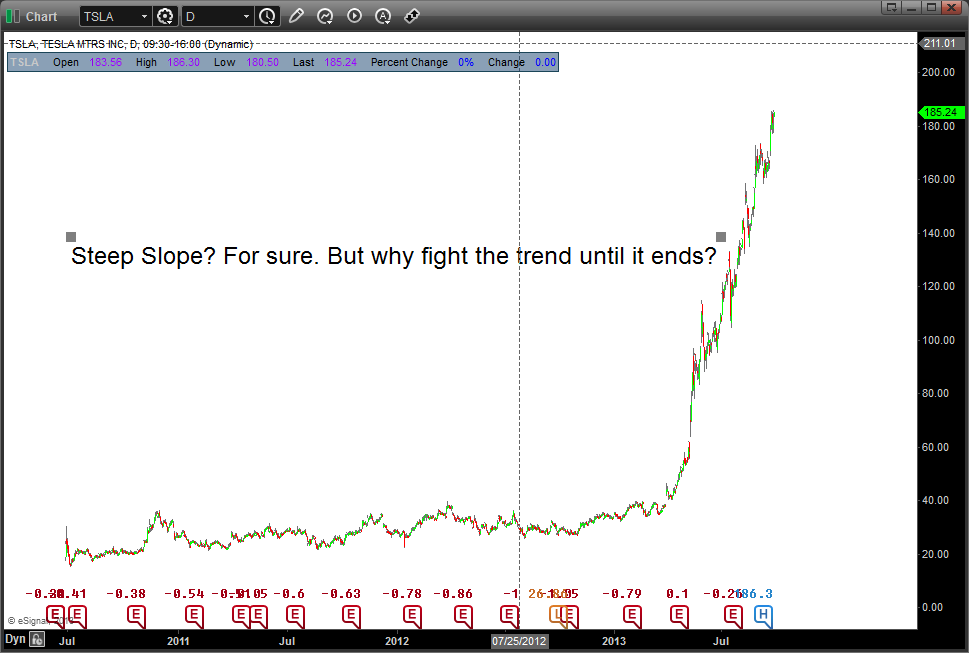
Such is the game with growth stocks-turned-cult stocks supported by a strong base of trend-followers — the trend doesn't end until it does. On that front, I wrote the following:

“The issue with trend-follower stocks such as TSLA is that a defined top first must be in place for the bears to get their days, and once the bears have the ball, they dare not blink or risk giving the game right back to the bulls.” The point where bears take control of Tesla stock clearly has not yet occurred, but when it does, it could smack TSLA a good 20% to 30% lower in a quick fashion.

Important to note, however, is that such a correction initially would not be much of a statement about the underlying fundamentals of the business, but rather a healthy mean-reversion move of the stock price. This would ultimately allow longer-term investors to consider the stock again, thus making it stronger. But for now … why fight the trend?
Picture
Given the tight patterns in which Tesla stock keeps moving higher, I have begun using a 21-day simple moving average (yellow line) to gauge near-term support for the stock.
Picture
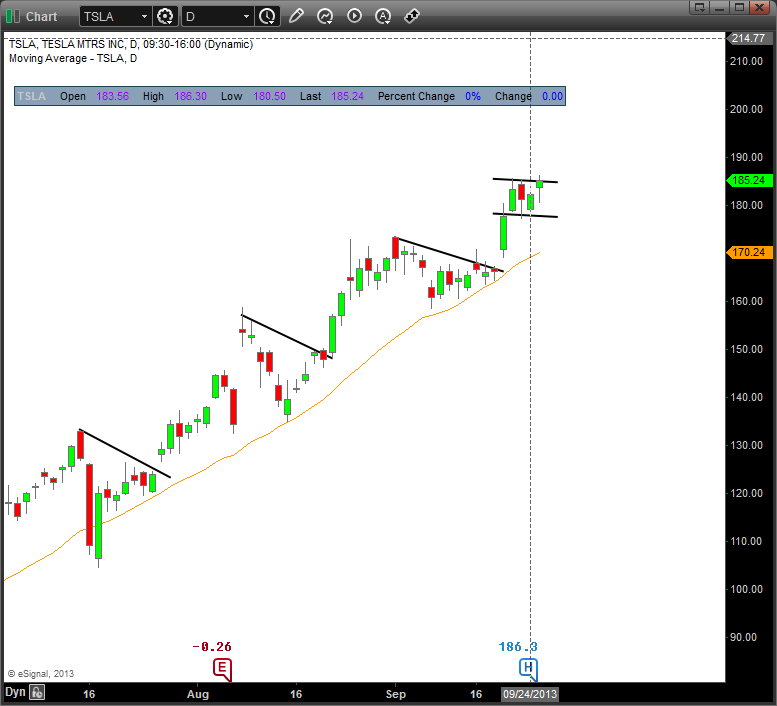
Most recently, TSLA again bounced off this moving average on Sept. 18, upon which the stock began to form a next small consolidation phase where it could pop higher from. Barring any one-day bearish reversals, I see no reason why Tesla stock can’t snuggle up toward the $200 area in coming weeks, although seasonal headwinds in October could well make the going a little tougher.

Should the stock fall meaningfully below the 21-day moving average, bulls might want to take a step back.
0 Comments

These 7 Stocks Haven’t Missed a Dividend Payment in 114 Years

11/9/2013

0 Comments

 
Picture
MARKET CONDITIONS

These seven stocks have done the impossible. Each one of them has paid a dividend like clockwork for over a century. In fact, the longest-standing dividend payer on the list hasn't missed a   payment since 1877 — when Rutherford B. Hayes was president.

Think of everything that has happened to our financial system since that time…World War I and II… The Great Depression, the dot-com bubble, government shutdowns… the list goes on.

For the seven stocks I’m about to show you though, it didn't matter. These companies breezed through every economic downturn America has ever faced without so much as a hiccup in their dividend payments. In fact, most of them were able to increase their payouts during those periods…

That’s pretty remarkable considering that in 2009 alone over 800 American companies had to cut their dividends because of the fallout from the subprime crisis. Now, to be fair, there is nothing secret about these stocks. You’ve probably heard of all these companies before. But to me, that’s not a deterrent. In fact, it’s part of what makes these seven stocks so attractive.

That’s because in all my years of investing, I’ve found that it’s not the high-flying tech startups or the risky biotech plays that make investors the most money.

Instead, from what I’ve seen, the most successful companies are the ones that we see every day… The ones that are so integral to our way of life, that if they disappeared tomorrow, it would have a direct impact on how we live.

Take one of the stocks on the list, Coca-Cola (NYSE: KO), for example. Ask anyone in the world for a Coke, and chances are that 99% of them will know what you’re talking about. Coca-Cola is such a dominant company that one of its biggest competitors — Dr Pepper Snapple (NYSE: DPS) — actually pays to use Coke’s distribution network.

Given that kind of market dominance, is there any question as to how Coca-Cola has been able pay an uninterrupted dividend since 1893… AND increase its payout by over 1,393% in the last 25 years alone?

Nothing is guaranteed, in my experience I've found that it’s companies like Coca-Cola, and the rest of the companies below – the ones that dominate their markets AND reward shareholders with steady (and increasing) dividends — that can make investors the most money in the market.
Picture
Every stock on the list above is one of the most dominant companies in the world. If any of these businesses were to suddenly go under, it would have a direct impact on the way we live of our daily lives.

That’s why when you own stocks like this in your portfolio, you don’t have to worry much about bear markets… recessions… government shutdowns… or rising interest rates. If history is any indicator, you just simply let their steady dividend payments grow your wealth year in and year out.

And those dividends have been good to the companies’ share prices as well. Despite being over 100 years old, each of these stocks has handily beaten the market in the last 10 years. The average total return for the seven stocks in this list is 185%, including dividends — significantly higher than the 99% total return for the S&P 500 over the same period.

Don’t get me wrong, past performance is never an assurance of future success. Just because these stocks have paid consecutive dividends for over a century, it doesn’t guarantee that they’ll continue to do it for another 100 years.

And in fact, as much as I like Coca-Cola, it does seem a bit expensive right now. It’s currently trading at a P/E ratio of about 20 — significantly higher than the S&P’s long-term average of 15.

But it just goes to show you that when you buy the market’s most dominant companies — the ones that have a competitive advantage in their industry and show a commitment to their shareholders — you’re buying companies whose dividend can withstand nearly anything… including the current economic environment.
0 Comments

These Stocks Could Rise 50% and They’d STILL Be Cheap

11/9/2013

0 Comments

 
Picture
MARKET CONDITIONS

Contrary to what you might see in the mainstream media, the world’s largest stocks are still cheap. That might surprise you… A lot of the biggest blue chips have delivered tremendous gains over the last two years. Home Depot, for example, is up 136%. Visa is up 118%.

But the 189 companies with a market value of $50 billion or more trade at a median 12.9 times forward earnings. That’s not expensive. And there’s one group of mega-cap stocks that’s dramatically cheaper than the rest of the pack


As you dig into the value in large-cap stocks, one sector jumps out… energy companies. Of the 10 major sectors, energy stocks are the cheapest by nearly every measure. Take a look…
Picture
The world’s largest energy stocks trade for just 9.1 times next year’s earnings estimates. That’s a 29% discount to the entire group… and a 28% discount to the 10-year average price-to-earnings ratio (P/E) on U.S. energy companies. They also pay hefty 4.2% dividends. That’s well above the 2.8% average and second only to utility stocks (which most investors buy solely for income).

If you look to energy stocks located in emerging markets, the value gets even better… particularly in Russia.

Russia’s three mega-cap oil companies are Gazprom, Lukoil, and Rosneft. It’s hard for U.S. investors to buy Rosneft. But Gazprom and Lukoil trade “over the counter.” In other words, they don’t trade on the NYSE or Nasdaq… But you should be able to buy them through your broker. And they’re trading at just 2.8 and 4.4 times earnings, respectively.

That’s as cheap as any stocks on the planet.

I know that the idea of putting money in Russia is scary. But at those prices, nearly everything can go wrong and investors can still make money.

In short, energy stocks are now the cheapest group of large-cap stocks on the planet. And Russian energy companies are the cheapest energy companies. They’re the cheapest of the cheap.

Investors looking for value should consider energy stocks in general… and Russian energy stocks specifically. These stocks could rise 50% if oil prices go nowhere… and they’d still be cheap.

Good investing,

0 Comments

This Stock Could Rocket Much Higher

11/9/2013

0 Comments

 
Picture
MARKET CONDITIONS

I’m a big fan of buying stocks that have recently hit a new all-time high. Clearly they have strong momentum, but the main reason is that, because there is no overhead resistance, they often go higher.

When that bullish chart is supported by a strong fundamental story, combined with a small, but steady dividend, the stock is often a winner. One stock that meets these criteria is small-cap Methode Electronics (NYSE: MEI), which manufactures component devices for original equipment manufacturers, including electronic, sensing and optical technologies.

With a market cap of just over $1 billion, this global manufacturer’s main business segments are automotive, interconnect and power products. Automotive — its largest segment — currently accounts for about 60% of the company’s revenue.

This division supplies electronic and electromechanical devices and sensors to companies like Ford (NYSE: F) and General Motors (NYSE: GM).

Ford uses Methode’s TouchSensor consoles for its MyFord driver connect console, a touch-screen dashboard-like console, which enables drivers to integrate their mobile phones and digital media players while driving.

General Motors also uses a similar console design, termed the K2XX, in its SUVs and trucks.

In the most recently reported fiscal first quarter of 2014, console sales to Ford and GM helped bring Methode’s total revenue to $167.3 million, a 41% increase from the year-earlier period. Net income ballooned nearly 250% from the year-earlier quarter to $13.8 million.

Better-than-expected console sales to General Motors and new European automotive products, as well as increased sales in the interconnect and power products segments, are expected to drive future growth.

The technical picture for MEI is strong.
Picture
Rising off a low under $7 in May 2012, shares formed a major uptrend and are up more than 300% to date. In February, shares catapulted nearly 20% in a single week — from about $10 to $12 — marking the start of an accelerated uptrend. Continuing its steady ascent, MEI broke above historical resistance, near $12, dating back to late 2010.

Upon breaking this resistance, the 50-day moving average bullishly crossed above the 200-day moving average, a highly bullish technical formation known as a “golden cross.” Since the golden cross occurred, shares have more than doubled in value, rallying from about $13 to a high above $28.

In late August, MEI rose several dollars in anticipation of strong fiscal first-quarter results. A better-than-expected report caused the sharp rally to continue. On Sept. 25, MEI made a new all-time high at $28.32. With no overhead resistance in sight, the stock could move much higher.

In my mind, it wouldn’t be unreasonable for shares to hit the $45 range within a year. At current levels, this target represents potential returns of over 60%.

The optimistic technical picture is supported by solid fundamentals. Over the past four quarters, Methode beat earnings estimates by an average of nearly 125%. Consistently solid results prompted management to upwardly revise its revenue and earnings expectations for the upcoming fiscal second quarter.

For the second quarter, analysts project revenue will rise 30% to $168.8 million from $129.8 million in the comparable year-earlier quarter.

With the expectation that product demand will continue to increase in all segments, management raised its full-year 2014 guidance to the range of $670 million to $700 million, a roughly 30% increase from $519.8 million last fiscal year.

The earnings outlook is also strong. For the fiscal second quarter, analysts expect earnings to increase 169% to $0.35 per share compared to $0.13 in the same quarter a year ago.

For the full 2014 fiscal year, management anticipates favorable raw material costs, combined with strong sales across its four major market segments, will contribute to a solid earnings gain. The company recently raised its guidance to the range of $1.40 to $1.60 per share, a 150%-plus rise from earnings of $0.56 a year ago.

Methode pays a small quarterly dividend of $0.07 per share, for a current yield of 1%.

Risks to consider: Methode’s strong growth outlook is, in part, based on strong performance expectations from new automotive consoles. However, if the economy weakens, so too could demand for cars, potentially causing a decrease in orders for Methode’s products. However, the company is well diversified and could weather a mild economic downturn.

Recommended Trade Setup:

– Buy Methode Electronics (NYSE: MEI) at the market price
– Set stop-loss at $16.99, below support marked by the intersection of the accelerated uptrend line and the August low
– Set initial price target at $43.99 for a potential 59% gain by mid-2014
0 Comments

How to Collect a Safe 17% or More a Year from Microsoft (MSFT)

11/9/2013

0 Comments

 
Picture
MARKET CONDITIONS


Today, I’ll show you how many investors have made 60%-80% on one of the world’s safest, cheapest businesses.

The idea was to buy shares of tech giant Microsoft at beaten-down, bargain prices and then sell someone the right to buy those shares from you at a higher price.

This is the practice called “selling covered calls.” Back in 2010, you could generate a 17% annual payout by selling covered calls on Microsoft.

As regular readers know, Microsoft has a dominant position in its industry. It’s the No. 1 software company in the world with $77 billion in annual sales. Its average profit margin over the last 10 years is an enormous 28%. And it’s paying a large (3.4%) and growing dividend.

It’s “crazy” to think you can use a big, blue-chip stock like that to produce a SAFE 17% return. But it was true in 2010. And as I showed my readers, it was true again in 2011… and again in 2012.

If you started with $10,000 three years ago and traded in a tax-free account, you’d have between $16,000 and $18,000 today. That’s a 60%-80% return. (It beats what “ordinary” shareholders have made by 50%-100%.)

If you’re willing to learn the basics of this strategy, you can still use Microsoft to safely collect 17% or more in annual income payments.

When you sell covered calls, you collect cash upfront for agreeing to sell your shares for a higher price. You give up some of your potential capital gains for guaranteed income and added safety.

So this practice isn’t for gamblers reaching for the moon. This is for folks interested in a safe 10%-20% return in a year.

Right now, you can buy Microsoft for around $33 per share. You can then sell the December $34 calls for $0.95. That produces an instant “yield” of 2.8%.

The calls expire in December, a little over two months from now. If the stock stays where it is or moves lower, you keep your shares… and you can sell another round of calls. Making this trade five times in a year will produce a 14% return.

If the stock has moved higher by then, you sell your shares at $34. That will give you a 5.9% return. And you can do it all over again. Making this trade five times in a year will produce a 29% return.

Add in the annual 3%-plus dividend Microsoft pays, and you’re collecting between 17% and 32% a year on a cheap, dominant tech stock.

This trade has been a winner for three years in a row. I expect it to be another big winner this year.
0 Comments

21 Dividend Champions Poised to Boost Payout

11/9/2013

0 Comments

 
Picture
MARKET CONDITIONS


One of the most gratifying things about compiling the Dividend Champions spreadsheet is witnessing the steady stream of dividend increases, which are announced throughout the year, in wave after wave, by the Champions, Contenders, and Challengers.

(Note that all references to Champions mean companies that have paid higher dividends for at least 25 straight years; Contenders have streaks of 10-24 years; Challengers have streaks of 5-9 years. “CCC” refers to the universe of Champions, Contenders, and Challengers.)

Recent dividend increases have come from Champions like Brady Corp. (BRC), Clarcor Inc. (CLC), and McDonald’s (MCD). The only thing better than reporting such increases is knowing ahead of time which companies are going to boost their dividends soon.

Fortunately, the vast majority of CCC companies have a habit of announcing dividend hikes about the same time each year. So it’s no stretch of the imagination to suggest that most of these companies can be expected to repeat this annual phenomenon.

The announcements can come anywhere from two days to more than two months before the Ex-Dividend Date, so I try to look ahead by about 11 weeks to provide adequate “warning” of the good news to come.

Currently, that means companies with Ex-Dividend anniversaries through Christmas Eve. (Note that RPM may have already announced an increase by the time you read this.) Here is the next group of companies that should boost their payouts, based on last year’s dates:
Picture
No.Yrs=Consecutive years of higher dividends; MR=Most Recent; DGR=Dividend Growth Rate; *Offers Company-sponsored Dividend Reinvestment/Stock Purchase Plan. Unlike brokerage “DRIPs,” these allow cash investments of as little as $25. For a list of No-fee company-sponsored DRIPs, click here.

Past as Prologue

Typically, the repeatability factor for these dividend increases is about 90%, which is worthy of some confidence. The percentage increases (dividend growth rates) may vary, but these companies have established a solid dividend “culture” and generally pass along the fruits of their labor, which means a portion of their growing profitability.
0 Comments

Buy This 13.1%-Yielder Now

11/8/2013

0 Comments

 
Picture
www.lightstreamresources.com
MARKET CONDITIONS


PROFILED: Lightstream Resources (LSTMF)

I won't hold back on this one. The company is called Lightstream Resources. It trades in Toronto as "LTS" and over the counter in the U.S. as "LSTMF."

With a price-to-book value ratio of just 0.44, Lightstream is the cheapest oil and gas producer on the Toronto Stock Exchange with a market cap above CAD 1 billion. To put that in perspective, you can buy Lightstream for about 75% less than the typical Toronto stock, which trades at 1.8x book value.

Lightstream is highly leveraged to oil prices, so if you're bullish on oil over the long haul, then you have to be bullish on Lightstream.

If oil rises, you'll see your share price and dividends rise along with it. Even if oil prices go down, the 13.1% yield will limit our losses and could still give us big gains.

Of course, any stock yielding double digits has to make you wonder if something is wrong with it. Lightstream's 13.1% yield shows the market is skeptical about its ability to maintain its dividend and grow production at the same time.

But in June, management stressed it was determined to keep its dividend intact. I believe it will make good on its promise.

Sure, I could I be wrong, but the point is, the market has already priced in a dividend cut. So if the cut doesn't happen, the share price will almost certainly rebound.

Even if it does cut the dividend, there's an upside: The cash the company saves will drive long-term production growth and improve the health of the business. In the meantime, we're getting paid a whole lot to hold a solid portfolio of assets.

As I said, this pick isn't for your mortgage money, so I didn't include it in our Canadian Solution report, which is reserved for stocks so reliable that they can get you through anything. And while they don't yield as much as Lightstream, they aren't exactly stingy, either. They should send you a stream of fat dividend checks for years ahead.

Speaking of distributions, if you like getting paid to hold a stock, you'll love investing in Canada. This is a country where executives believe in paying back investors, and where 10% dividends are routine.

While the tightwads of the Dow dribble out weak 2% dividends, Canadian firms routinely crank out five times more—and they send them out monthly.
0 Comments

This Stock’s 10.1% Yield Looks Safe

11/8/2013

0 Comments

 
Picture
MARKET CONDITIONS

“In this world, nothing can be said to be certain, except death and taxes.” – Benjamin Franklin

Unfortunately, there isn’t a good way to invest in government tax receipts at this time. Treasury bonds are a horrible investment and will continue to be as interest rates rise. But death is another story.

I hate to be morbid, but it’s a booming business. It’s recession-proof. And people don’t stop giving up the ghost just because times are tough. You can see from the chart below that deaths have risen steadily for decades.
Picture
Obviously, that’s because the population has grown significantly. The more people who are alive, the more who will eventually die.
If you’re in the death business (or investing in one), it’s a great time to be alive. That must be why Wealthy Retirement reader Jim asked me to look at the dividend safety of Stonemor Partners L.P. (NYSE: STON), a master limited partnership that owns 277 cemeteries and 92 funeral homes in 28 states.

The company first started paying a distribution in 2005 and has raised it every year since at an average rate of 3%.

Even more, the current 10.1% dividend yield is exciting enough to raise the dead.

In the first half of 2013…
  • The company’s revenue grew by $1 million to $122 million.
  • Distributable free cash flow climbed 57% to $42.5 million.
  • It paid out $25.2 million in distributions for a payout ratio of just 59%, compared with 87% last year during the same period.

Now, keep in mind, of that $42.5 million, $8 million was related to a legal settlement that Stonemor won. But even without that $8 million, the payout ratio would still be a healthy 73%.

In all of last year, shareholders received $47.4 million in distributions against $65.3 million in distributable cash flow for a payout ratio of 72%. That’s lower than the 90% and 84% payout ratio figures for the full years 2011 and 2010 respectively.

The payout ratio represents the percentage of earnings or cash flow paid out in the form of dividends. Most analysts use earnings to calculate their payout ratios. Most analysts are also lazy. I use cash flow because it’s a more accurate representation of a company’s ability to pay the dividend.

Stonemor is not in the habit of giving shareholders big raises and management is committed to acquire more funeral homes, so I wouldn’t expect any large dividend increases in the near future. But as far as the safety of the dividend, unless we see distributable cash flow start to slide, it’s safe.

Stonemor has plenty of cash flow to sustain the distribution. And if management wants to continue growing the distribution by a few percentage points, it should have no problems there either.

Dividend Safety Rating: B

If you have a stock whose dividend safety you’d like me to analyze, leave the ticker in the comments section below.
Picture
0 Comments

This Trade Could Make You 6% in 1-3 Weeks

11/8/2013

0 Comments

 
Picture
MARKET CONDITIONS


PROFILED:  SodaStream International (NASDAQ: SODA) 

Home beverage carbonation systems manufacturer SodaStream International (NASDAQ: SODA) had a great run from November 2012 into its early June 2013 highs.

Since then, however, the stock has traded in a much less orderly fashion, and this week, it finally fell out of a bull flag formation, snapping several important moving averages and trendlines. As a result, the stock now looks to have further downside ahead.

The business of selling water carbonation systems isn’t what many would consider “sexy.” Yet, SODA reacts well to technical analysis and has just the right amount of volatility and plenty of volume to satisfy traders.

The company went public in November 2010, and its relatively recent arrival on stage may be part of the reason it’s gotten so much attention from the trading community.

But with the stock breaking key near-term support levels and the next major distraction (its Nov. 4 earnings announcement) not scheduled for another three-plus weeks, traders looking to play some near-term downside have plenty of time to do so.

Since it began trading, SODA has seen plenty of swings with the occasional up/down gap after major news announcements. But through a technical lens, the stock has acted in a fairly orderly manner.

Unlike some of the new social media offerings, SODA started off its career as a publicly traded company with a bang. From its debut in November 2010 to its double-top in July/August 2011, the stock rose roughly 300% with constant bidding pressure under the stock.

Like many IPOs though, too much of a good thing gets punished as rookie stocks go through growing pains. The summer 2011 double-top eventually led to the stock wiping out almost the entire honeymoon rally in just two months, finding a bottom in October 2011.

SODA then spent the next 13 months or so in a much more humble trading range, which did however establish a series of marginally higher lows versus the October 2011 bottom.

This “good” behavior was eventually rewarded with a beauty of a breakout past a 15-month resistance line in January of this year. From there, the stock rallied strongly into a June top, which could be looked at as a retest of the summer 2011 highs.
Picture
Moving on to the daily chart below, the recent technical damage is clearly visible. On Monday, SODA sliced through its 50-day and 100-day moving averages (not shown on chart), as well as its November 2012 uptrend line. 

The selling continued Tuesday, thus confirming this weakness is unlikely to halt right away. SODA gave traders plenty of warning that a wait-and-see approach heading into October was warranted. After topping in early June, the stock began to develop a wedge pattern and a lower high in mid-September, after which it continued to reject the June-to-September resistance line. 

Finally, with Monday’s selling, SODA cracked and now looks to have room to fall toward its 200-day simple moving average (blue line).
Picture
Recommended Trade Setup: – Short SodaStream International (NASDAQ: SODA) at $61.25 or higher
– Set stop-loss at $63.50
– Set initial price target at $57.70 for a potential 6% gain in 1-3 weeks
0 Comments

Equity Players Have Apple In Sight

11/8/2013

0 Comments

 
Picture
MARKET CONDITIONS

After its notable rally off the late June lows, Apple (NASDAQ: AAPL) began to top out in the second half of September. After trading sideways to slightly lower for a couple of weeks, the stock gapped down 5.6% on the morning of Sept. 11, the day after it announced of a fresh batch of iPhones.

Last week, however, AAPL found support near its 100-day simple moving average and the 50% retracement level of the entire June-to-August rally. The odds now favor a resumption of its uptrend.

Furthermore, with the company’s next earnings announcement scheduled for Oct. 24, traders have a few weeks to potentially play the stock from the long side without any news to shake things up. Personally, I have found great success swing trading AAPL, as it seems to respect technical patterns particularly well in two-to-three-week time frames.

Additionally, given the strong emotional attachment many investors have to their positions, the stock often displays basic trend breaks and candlestick signals that offer great trade setups.

Looking at the long-term chart, we see the stock began its astonishing multi-year climb in 2009, breaking above the 200-week moving average (lower blue line). The sell-off into April 2013 can still be looked at as merely a much-needed mean reversion move.

Of course, investors who bought the stock above the $600 mark may not find much solace in that statement. But the fact remains that AAPL, with its apparent double-bottom in April and June, bounced to exactly the level it should have, namely the 200-week moving average.

As further proof of how well the stock often reacts to straightforward technical analysis, notice how the rally off the double-bottom moved it into a resistance area made up of its 100-week simple moving average (upper blue line) and the underbelly of the 2009 uptrend (straight diagonal line). AAPL moved into this resistance area and eventually rejected it just as it announced its new iPhone 5C and 5S, as well as the new iOS 7.

Picture
Now that we have a good idea of where the stock trades in the broader sense, let’s take a look at the closer-up daily chart. After a sharp 30%-plus rally in roughly seven weeks off the June lows, AAPL bumped into the aforementioned resistance area near the $510 area. From there, after some back-and-forth trading, the stock gapped down on Sept. 11, the day after the announcement of the new iPhones. But after a few days of weakness, AAPL found support at its 100-day simple moving average (blue line), which had acted as resistance throughout the middle part of this year.

Each stock respects different moving averages, and for the past two years or so, AAPL has respected its 100-day simple moving average better than any other moving average in the daily time frame. After bumping into it on Sept. 16, which at the time also coincided with a 50% retracement of the rally off the June lows, the stock bounced the following day with follow-through buying on Sept. 18.

On Friday, Sept. 20, AAPL left a somewhat concerning outside day candlestick behind on its daily chart, which is why I wanted to wait for Friday’s high to again be reached to fill the downside gap from Sept. 11 before entering a long-side trade. This happened on Monday on positive news regarding iPhone sales, and it is now time to get long AAPL.

Picture
Recommended Trade Setup: – Buy Apple (NASDAQ: AAPL) at the market price
– Set stop-loss at $482.20
– Set initial price target at $520 for a potential 6% gain in 2-4 weeks
0 Comments
<<Previous
Forward>>

    RSS Feed

    Archives

    December 2014
    November 2014
    March 2014
    February 2014
    January 2014
    December 2013
    November 2013
    October 2013
    September 2013
    August 2013
    July 2013
    June 2013
    May 2013

Powered by Create your own unique website with customizable templates.